Overview
Streamline your data management in Google Sheets by mastering the art of creating filters. Optimize your workflow by organizing and categorizing information effortlessly. Elevate user experience with custom filters for easy data identification and retrieval. This comprehensive guide walks you through a seamless process, empowering you to efficiently create and apply filters in Google Sheets. Enhance your data management strategies, ensuring increased efficiency and clarity in your spreadsheet tasks.
Who is Google Sheets best suited for?
Google Sheets is best suited for a wide range of professionals, including Financial Analysts, Project Managers, and Data Analysts. For example, Financial Analysts can use Google Sheets for financial modeling and budgeting, Project Managers can leverage it for tracking project timelines and tasks, and Data Analysts can use it for organizing, analyzing, and visualizing data, all benefiting from Google Sheets’ real-time collaboration and powerful data processing capabilities.
How to create a filter in Google Sheets
1. Start by selecting the entire list on screen.
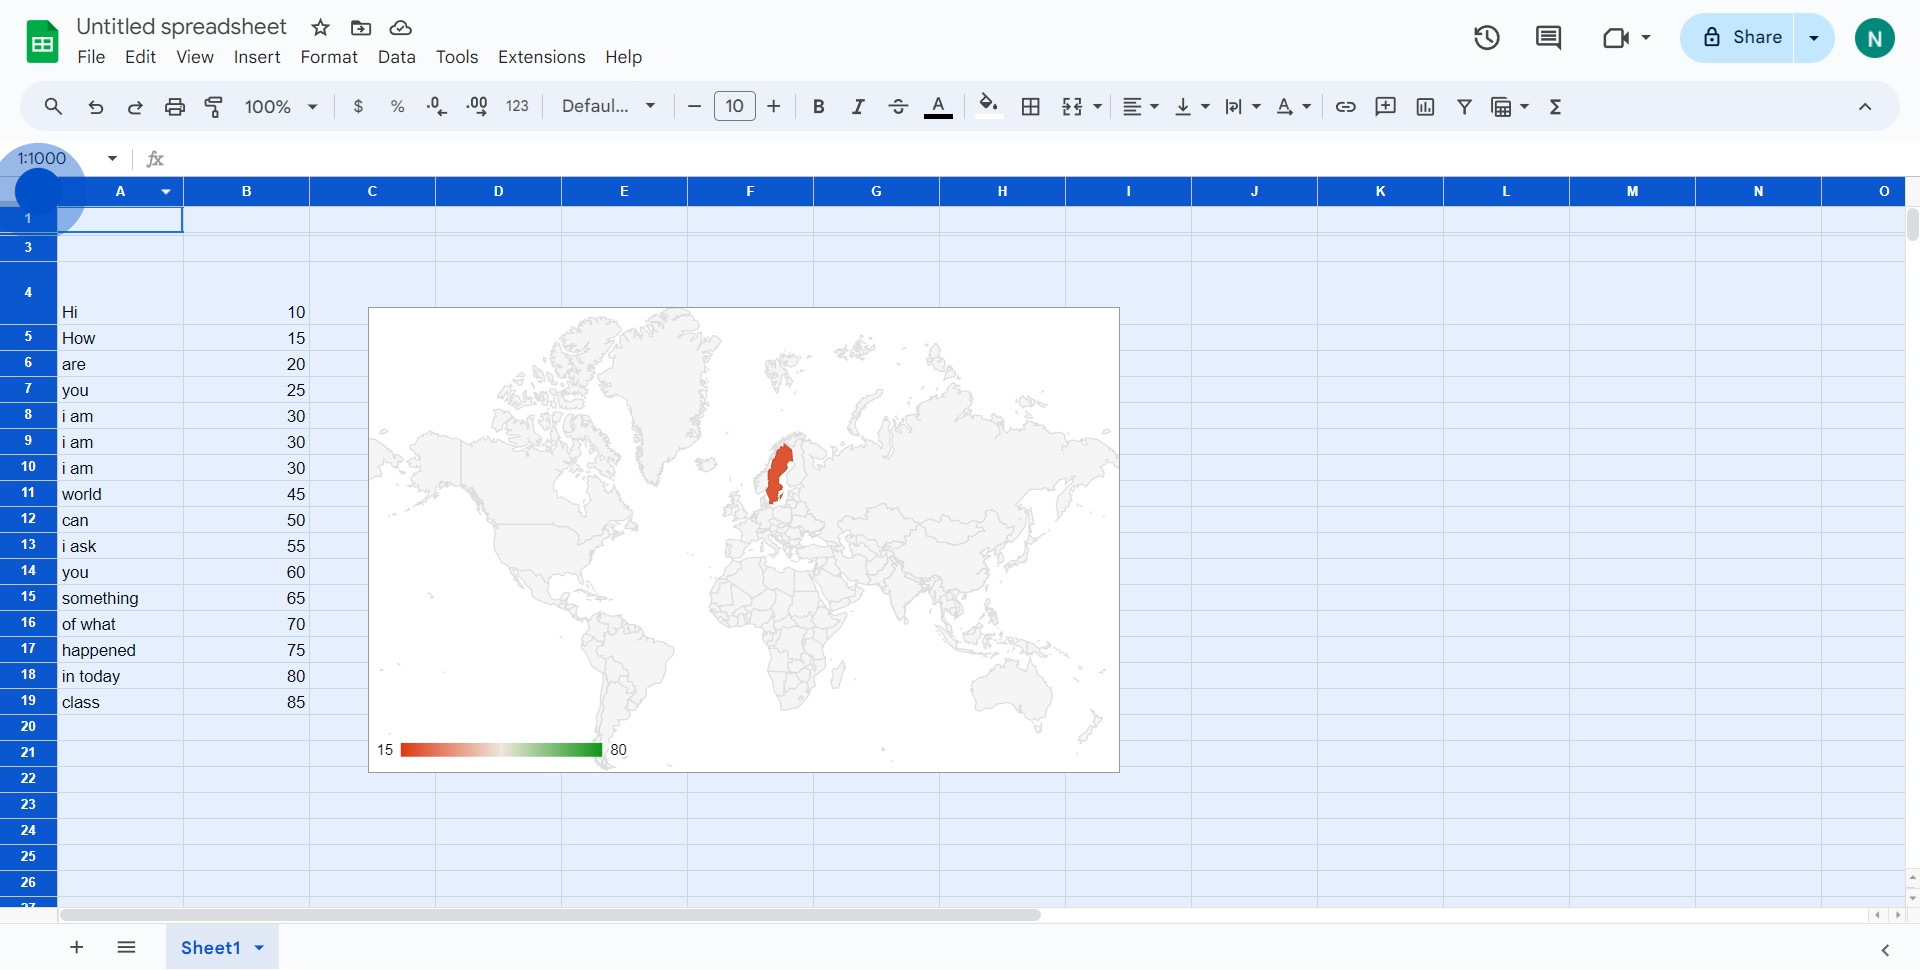
2. After selection, find and click the 'Insert' option.
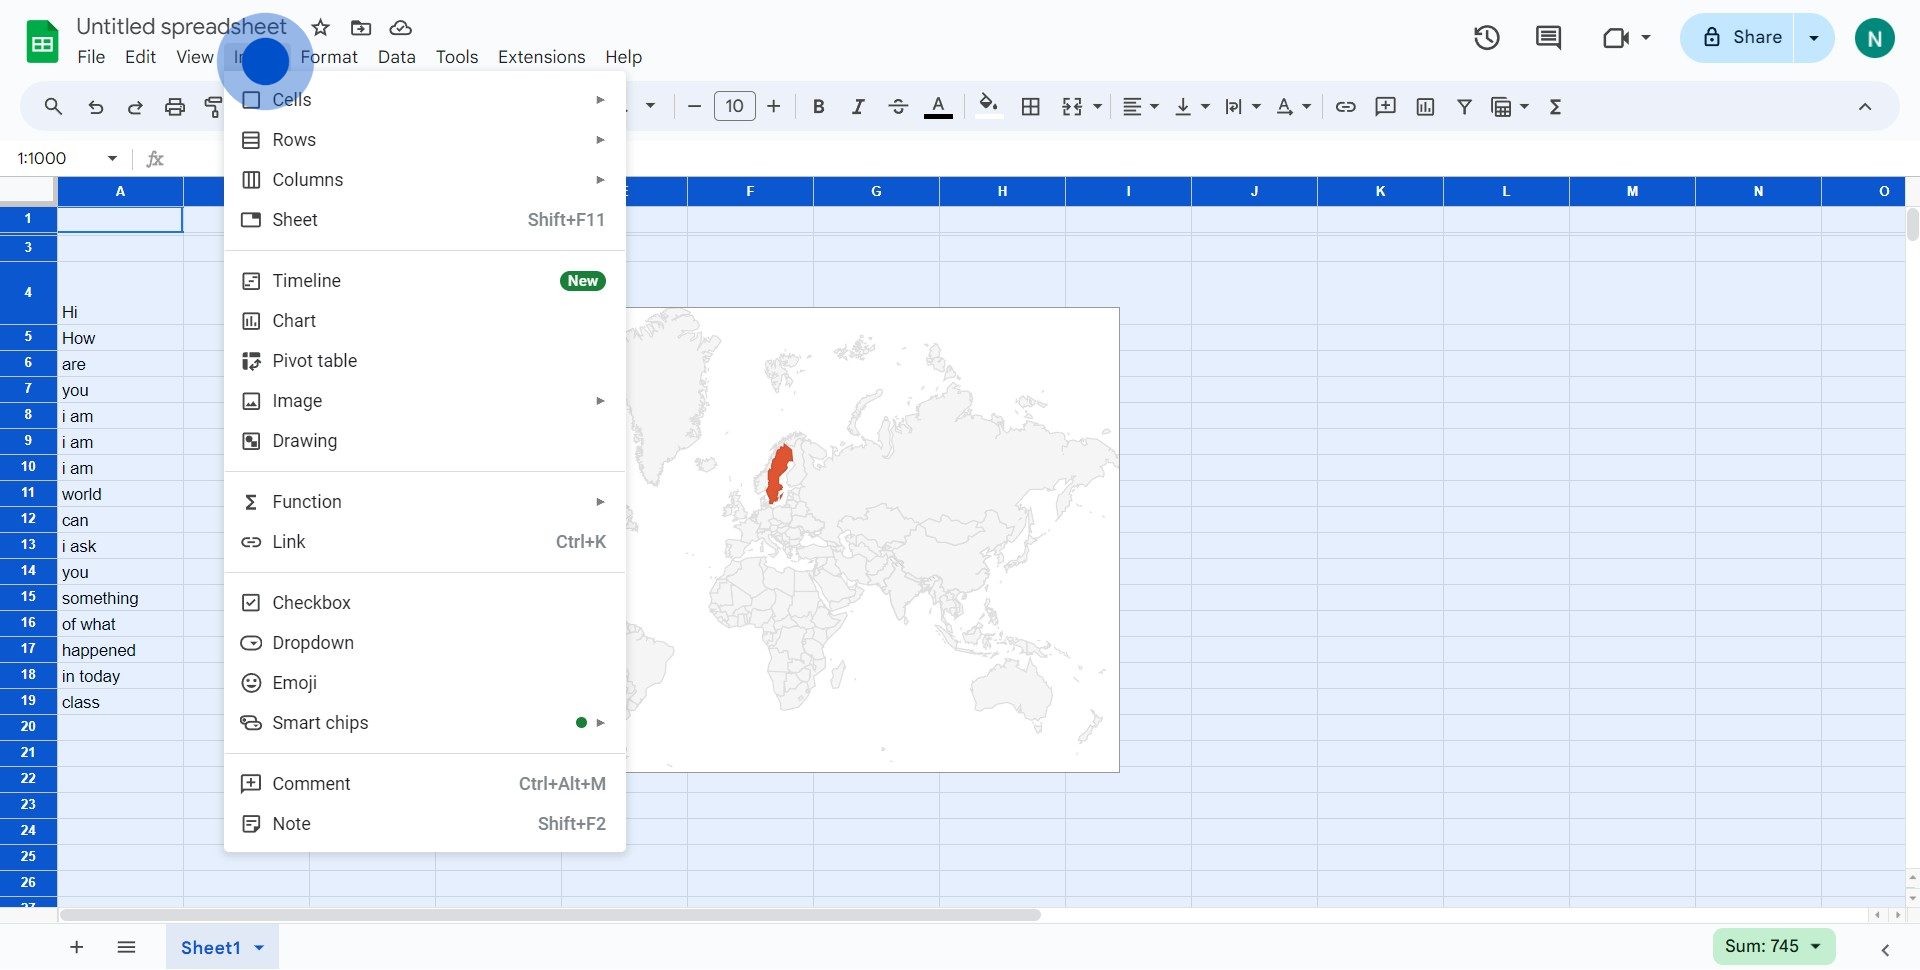
3. Proceed by selecting the 'Function' option.
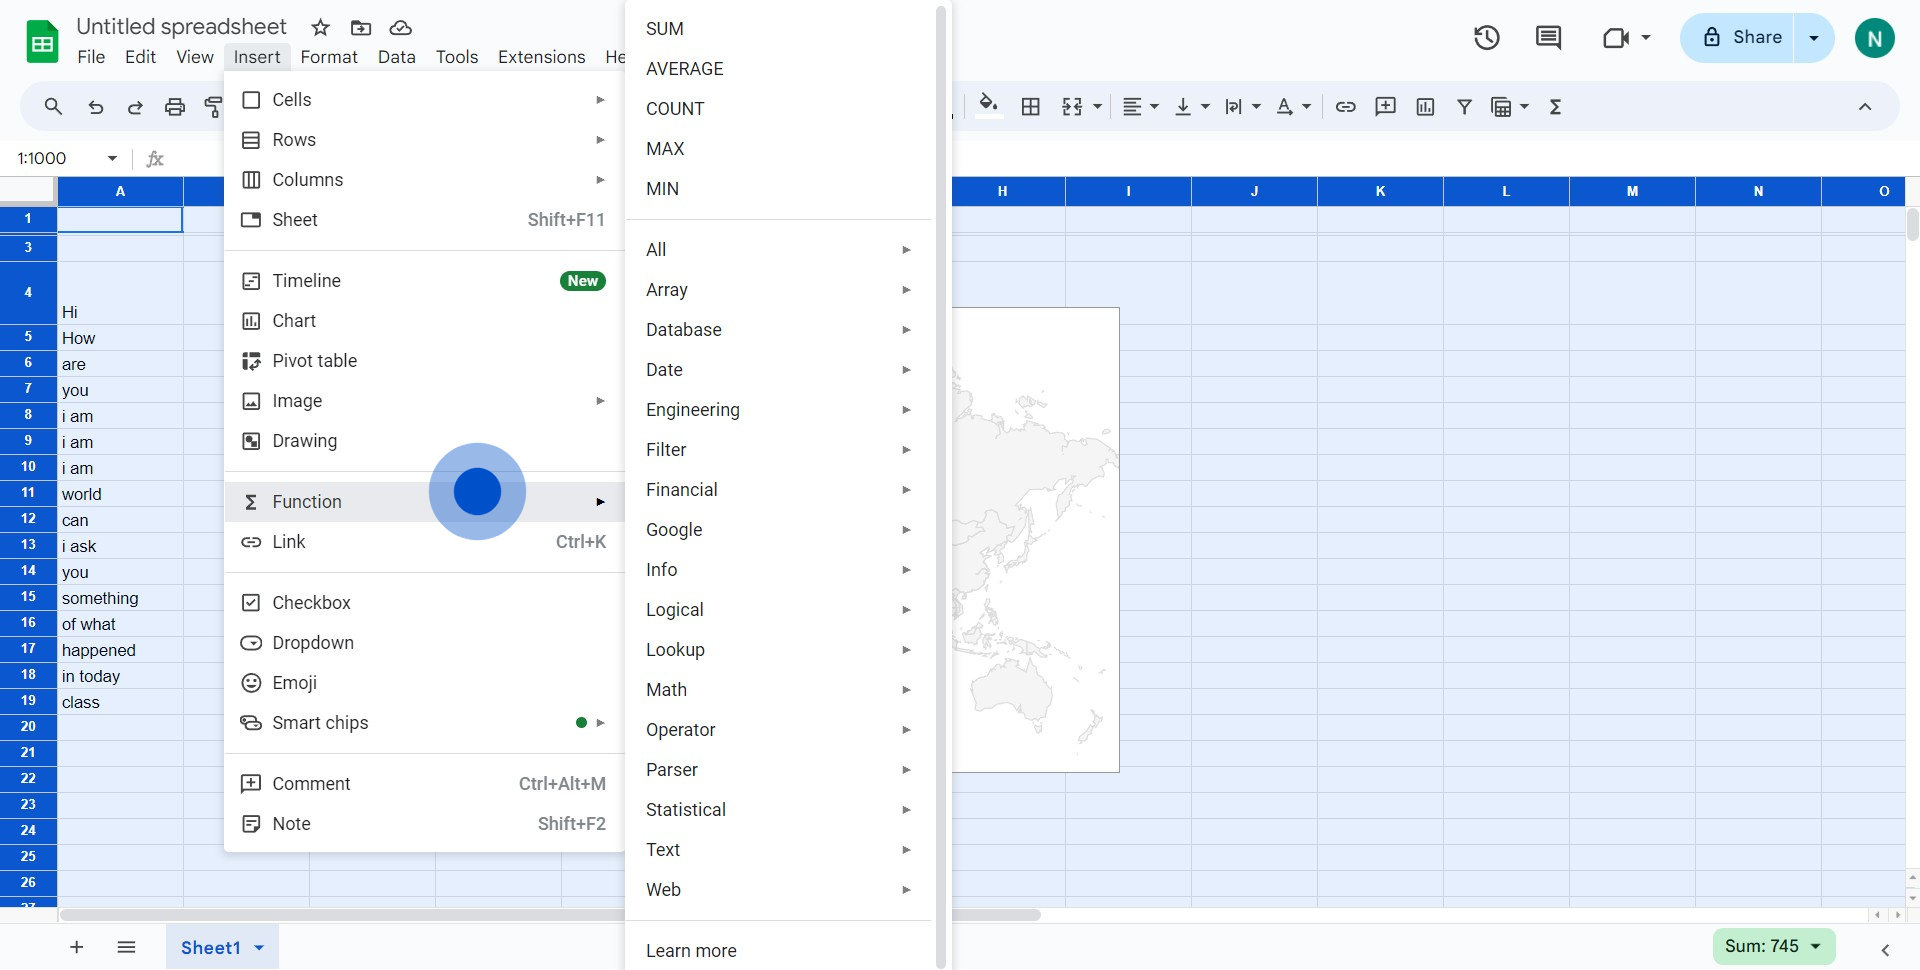
4. Next, spot and click on 'Filter►' from the dropdown.
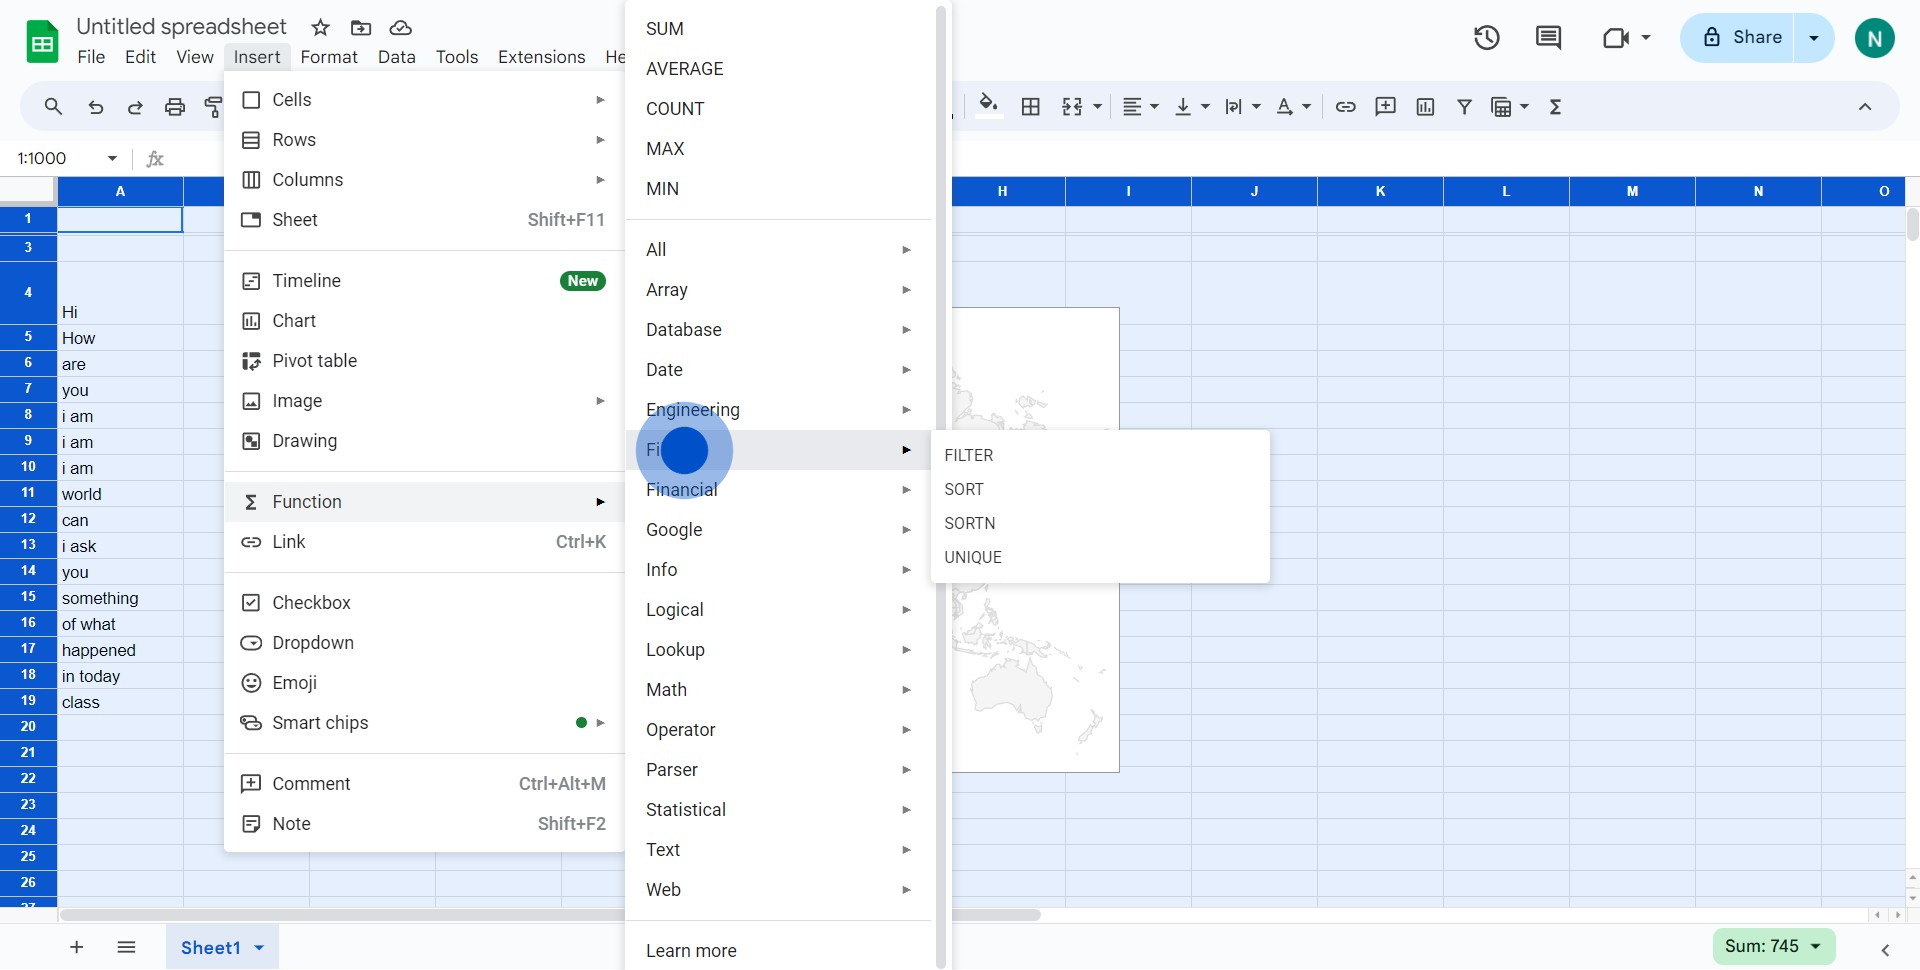
5. Now, click on 'Filters a range based off provided conditions'.
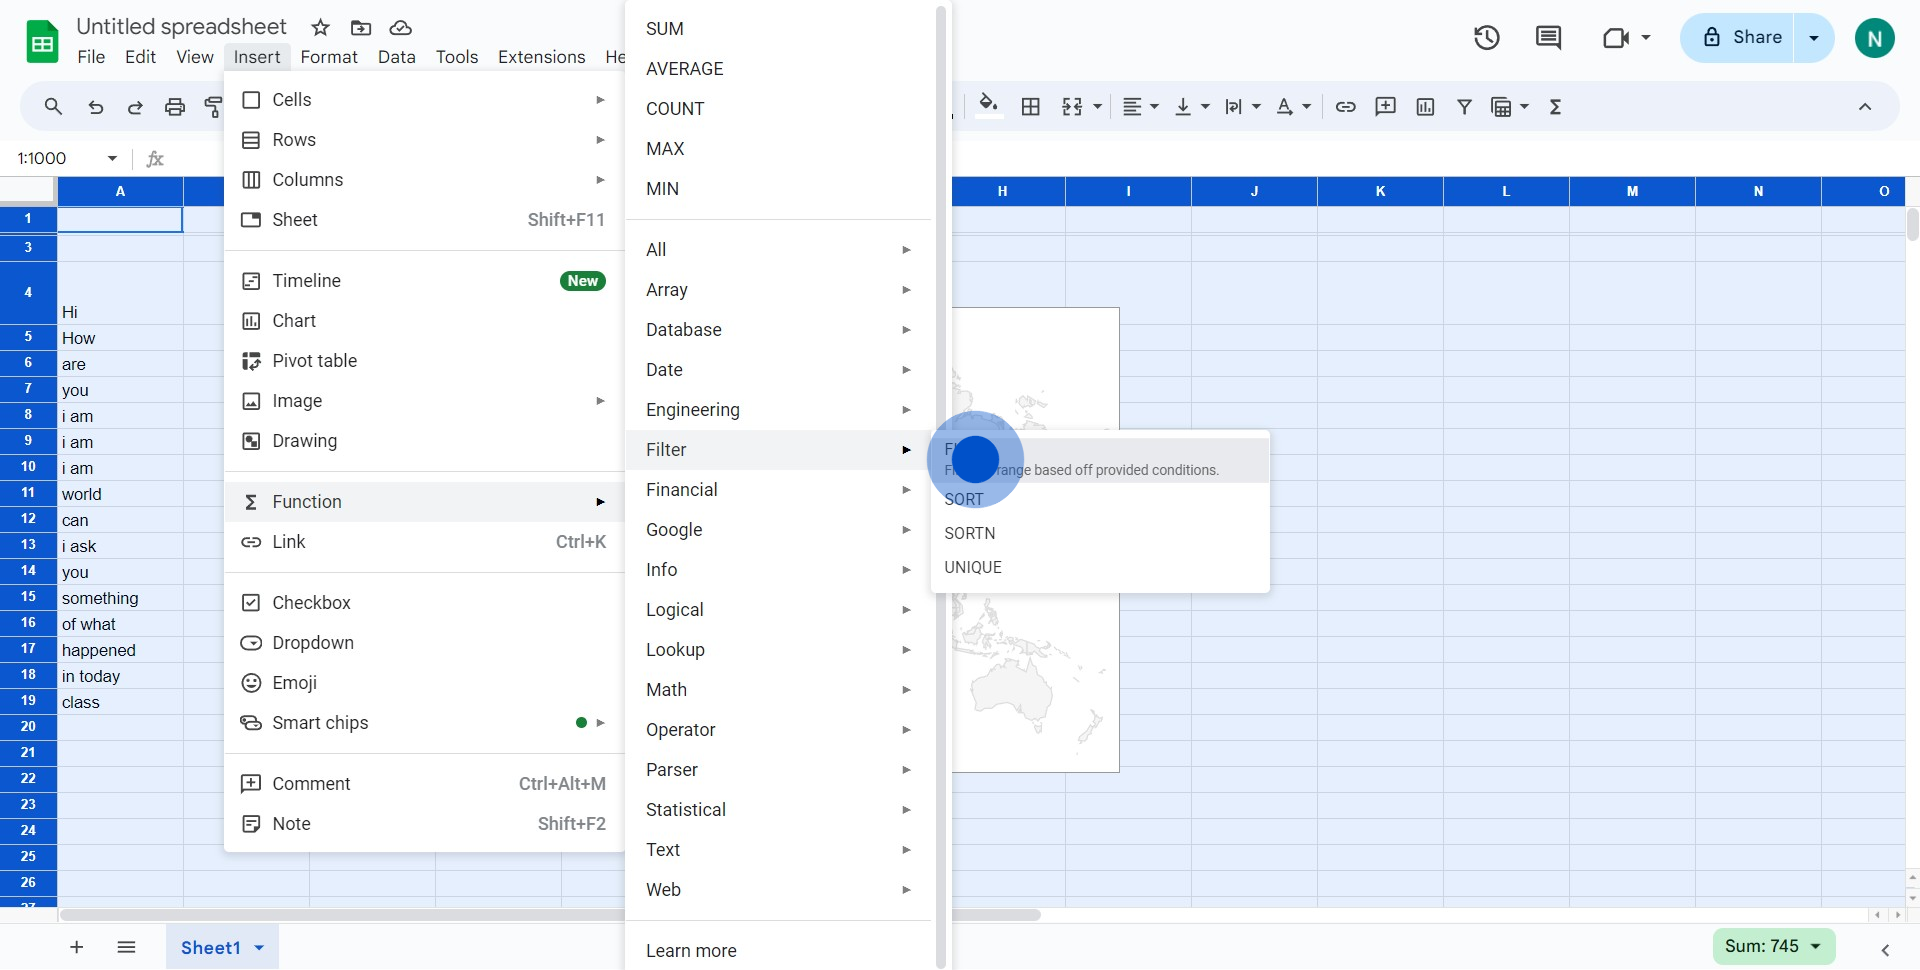
6. Finally, set up your filter as needed and apply changes.
Common FAQs on Google Sheets
Commonly asked questions about this topic.
How do I create and use formulas in Google Sheets?
To create a formula in Google Sheets, click on a cell where you want the result to appear, type an equals sign (=), and then enter the formula. For example, to add the values in cells A1 and A2, you would type =A1+A2. Google Sheets offers a wide range of built-in functions, such as SUM, AVERAGE, VLOOKUP, and IF. You can find functions by clicking on the “Functions” button in the toolbar or by typing them directly. Formulas can reference other cells or ranges, and you can use operators like +, -, *, and / to perform calculations. Google Sheets also provides suggestions and autocomplete to help you build accurate formulas.
How can I collaborate on a Google Sheets document?
To collaborate on a Google Sheets document, click the “Share” button in the top-right corner of the screen. Enter the email addresses of the people you want to share the sheet with, and choose their permission level (e.g., Viewer, Commenter, Editor). Once shared, collaborators can work on the sheet simultaneously, with their changes appearing in real-time. You can also use the “Comments” feature to leave notes or suggestions on specific cells. The “Version history” feature allows you to see all the changes made by collaborators and restore previous versions of the document if needed.
How do I analyze data using pivot tables in Google Sheets?
To create a pivot table in Google Sheets, select the range of data you want to analyze, then go to the “Data” menu and choose “Pivot table.” A new sheet will be created with the pivot table editor, where you can add rows, columns, values, and filters to organize and summarize your data. For example, you can group data by categories, calculate sums or averages, and filter out specific values. Pivot tables are a powerful tool for analyzing large datasets, allowing you to gain insights and identify trends in your data quickly. You can also update the pivot table if your data changes, ensuring your analysis remains accurate.
Create your own step-by-step demo
Scale up your training and product adoption with beautiful AI-powered interactive demos and guides. Create your first Supademo in seconds for free.
Nithil Shanmugam
Nithil is a startup-obsessed operator focused on growth, sales and marketing. He's passionate about wearing different hats across startups to deliver real value.
