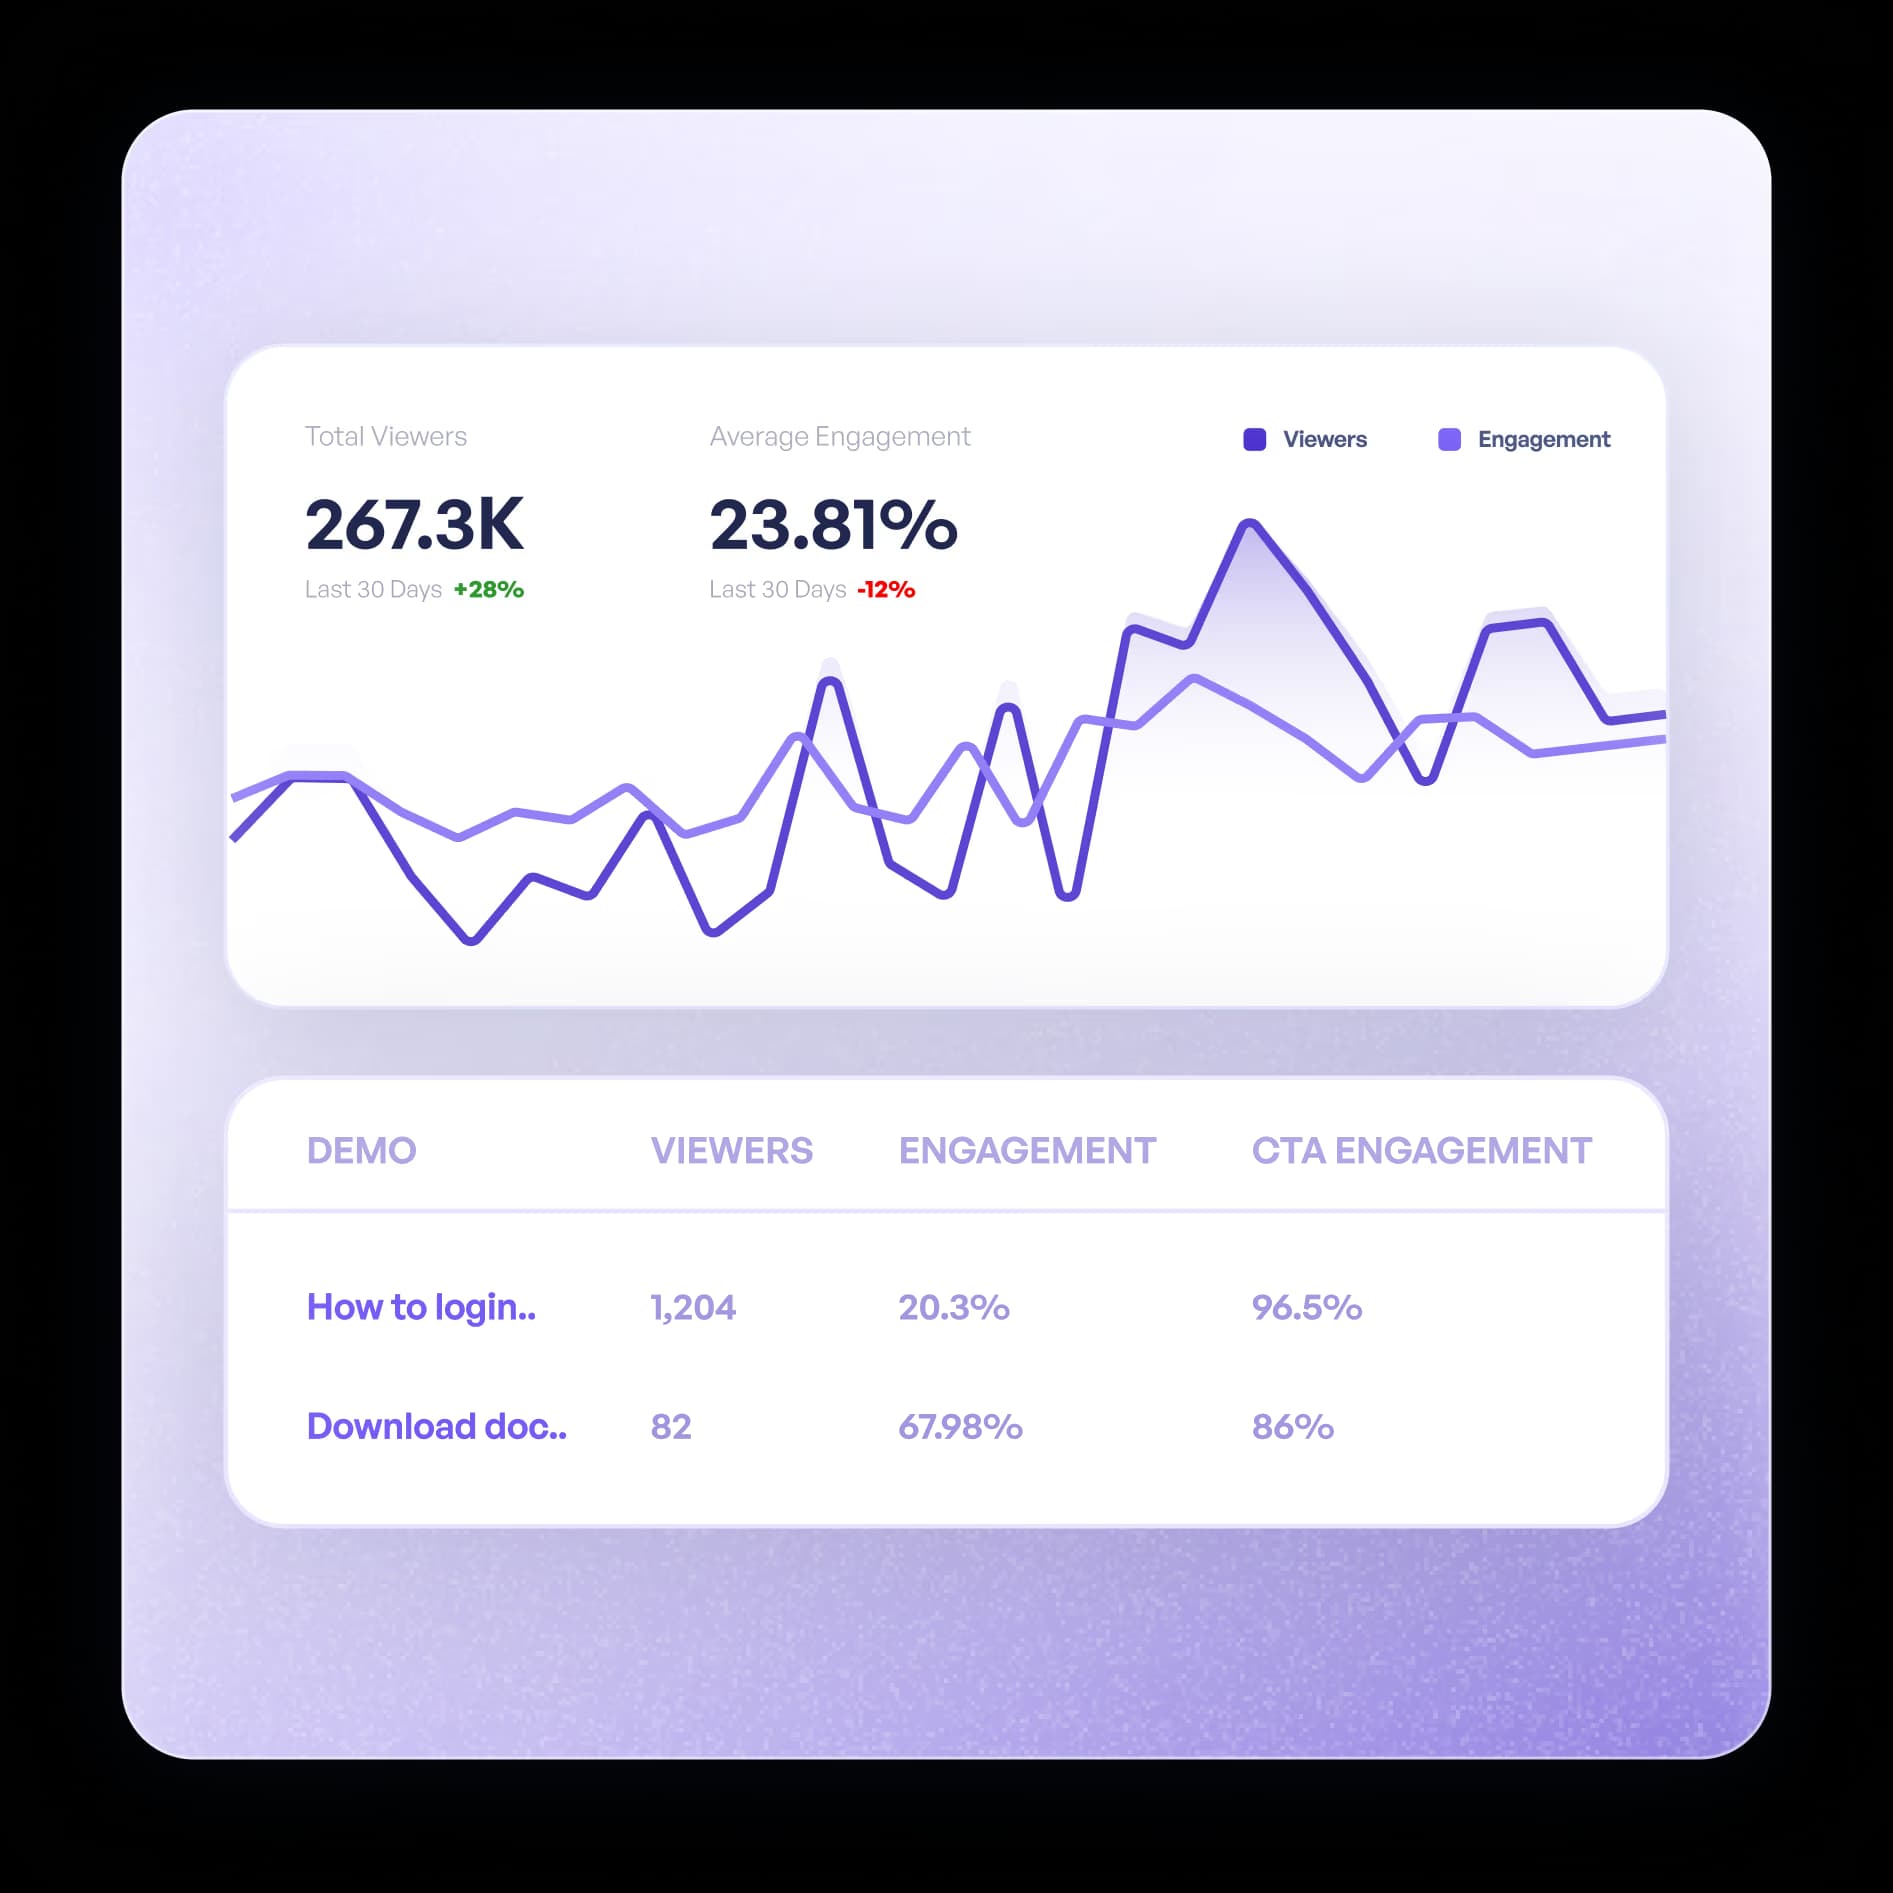
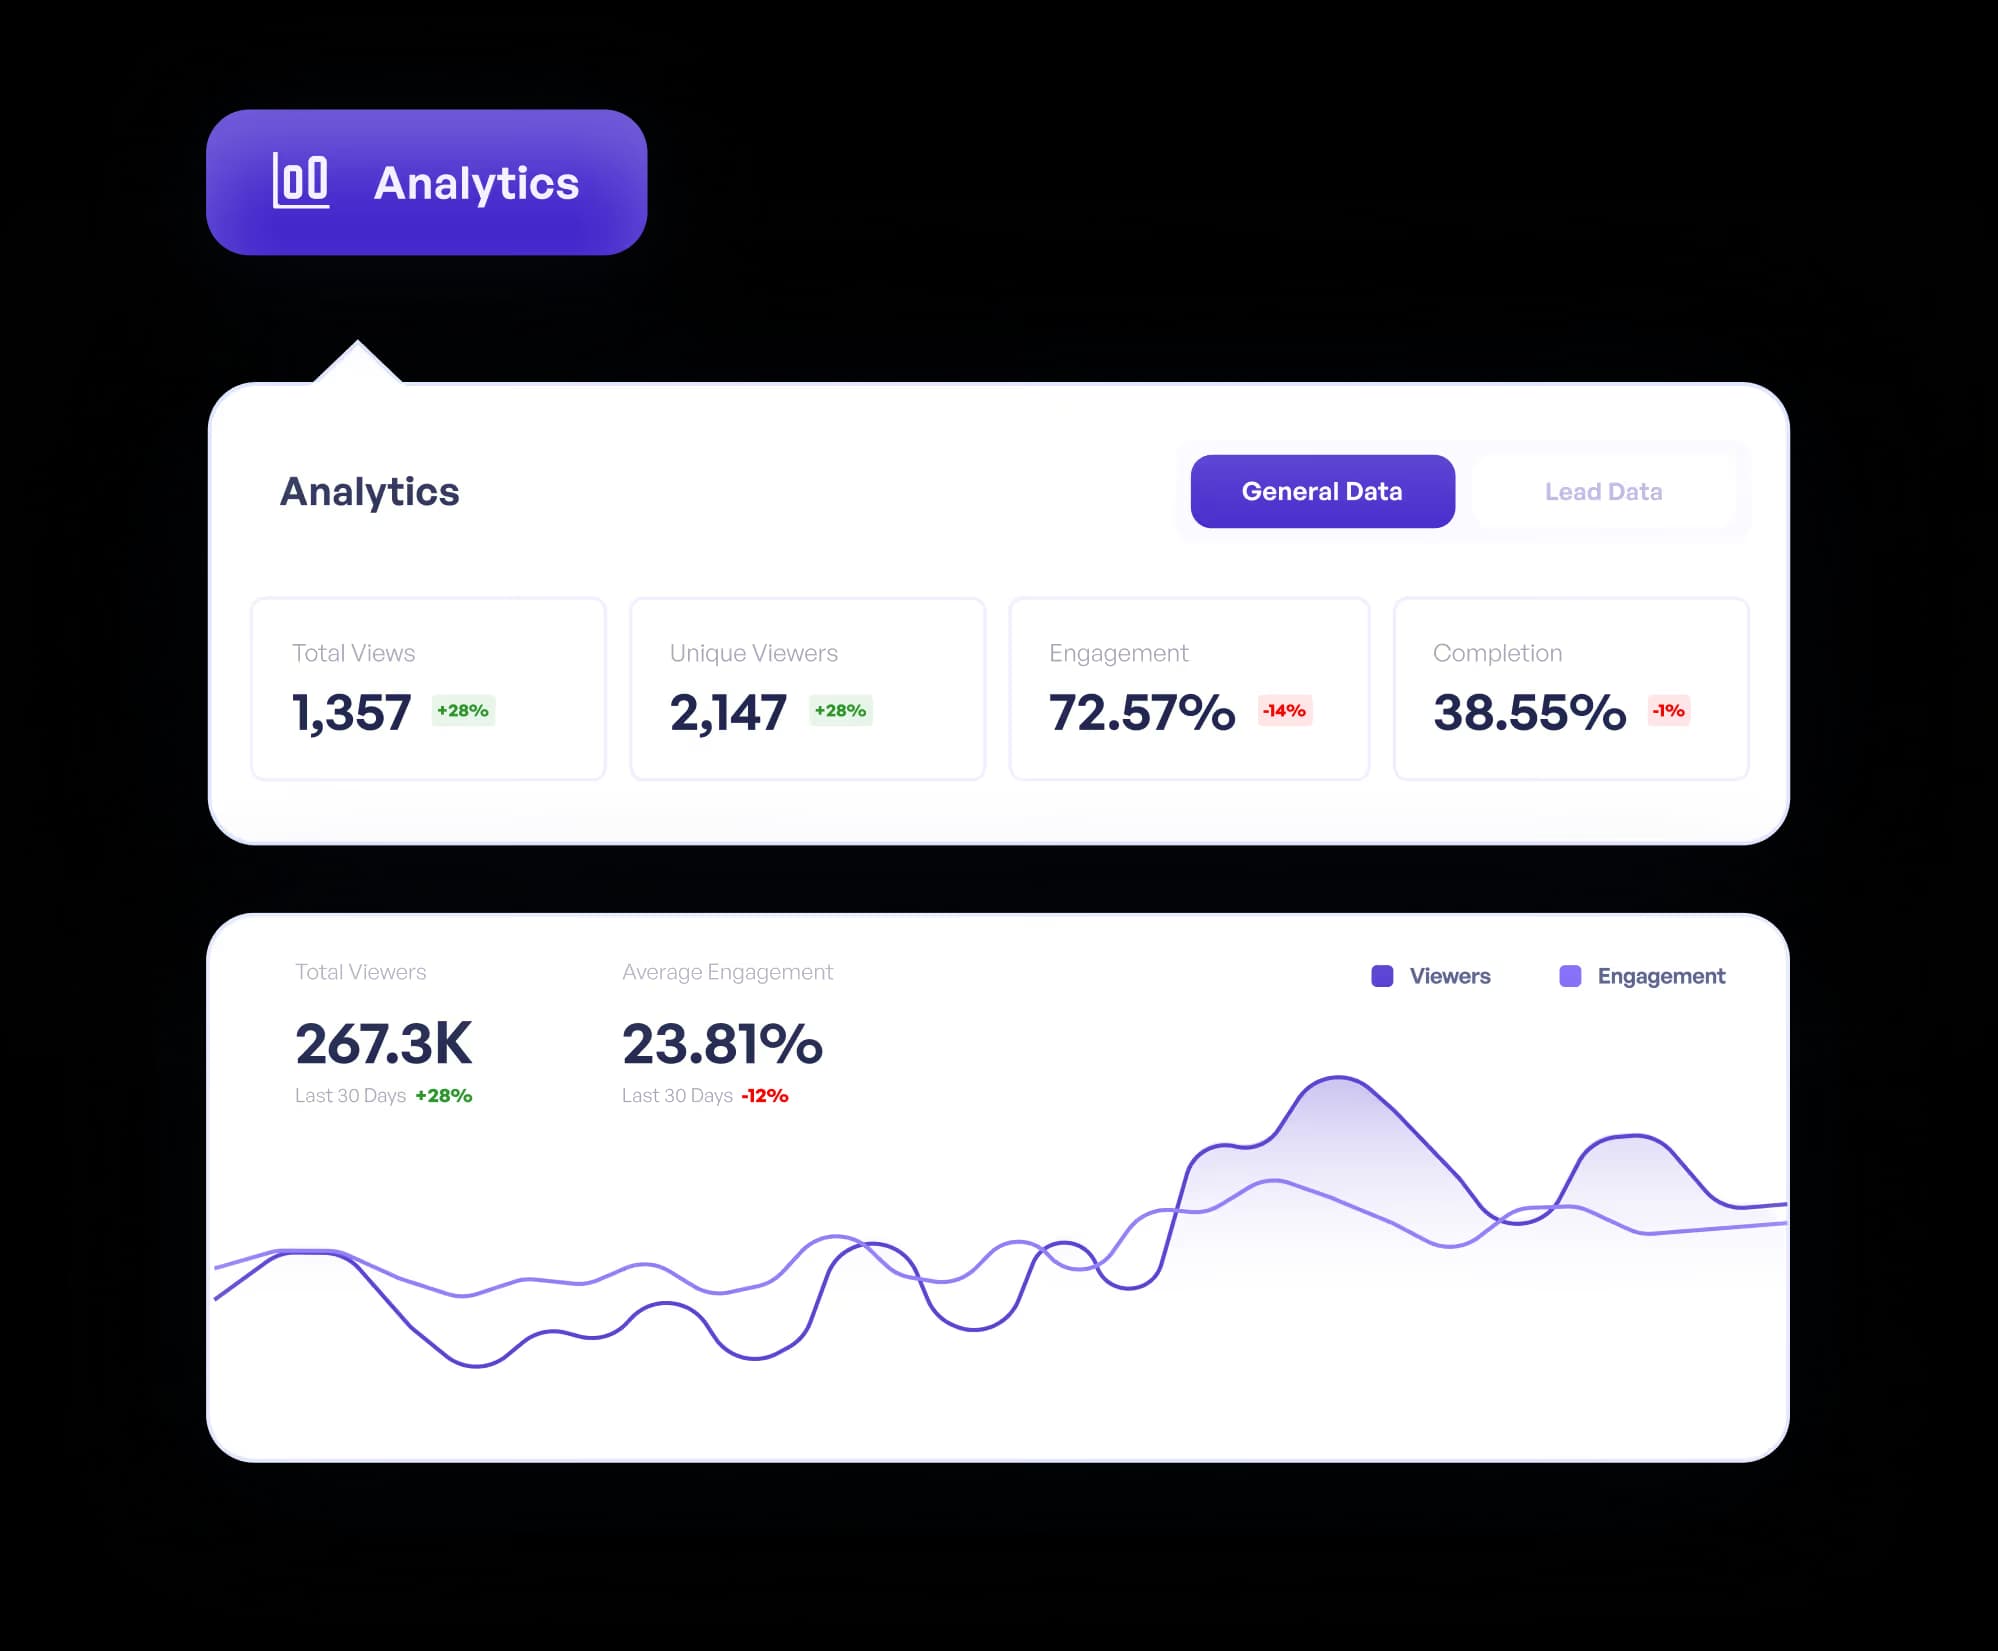
Track workspace analytics
Track key metrics like viewer counts, average engagement, and completion rates. Quickly identify top-performing demos and double down on successful demo strategies.
Evaluate and improve the performance of your Supademo by tracking viewers, engagement, and completion rates and more.
Track key metrics like viewer counts, average engagement, and completion rates. Quickly identify top-performing demos and double down on successful demo strategies.
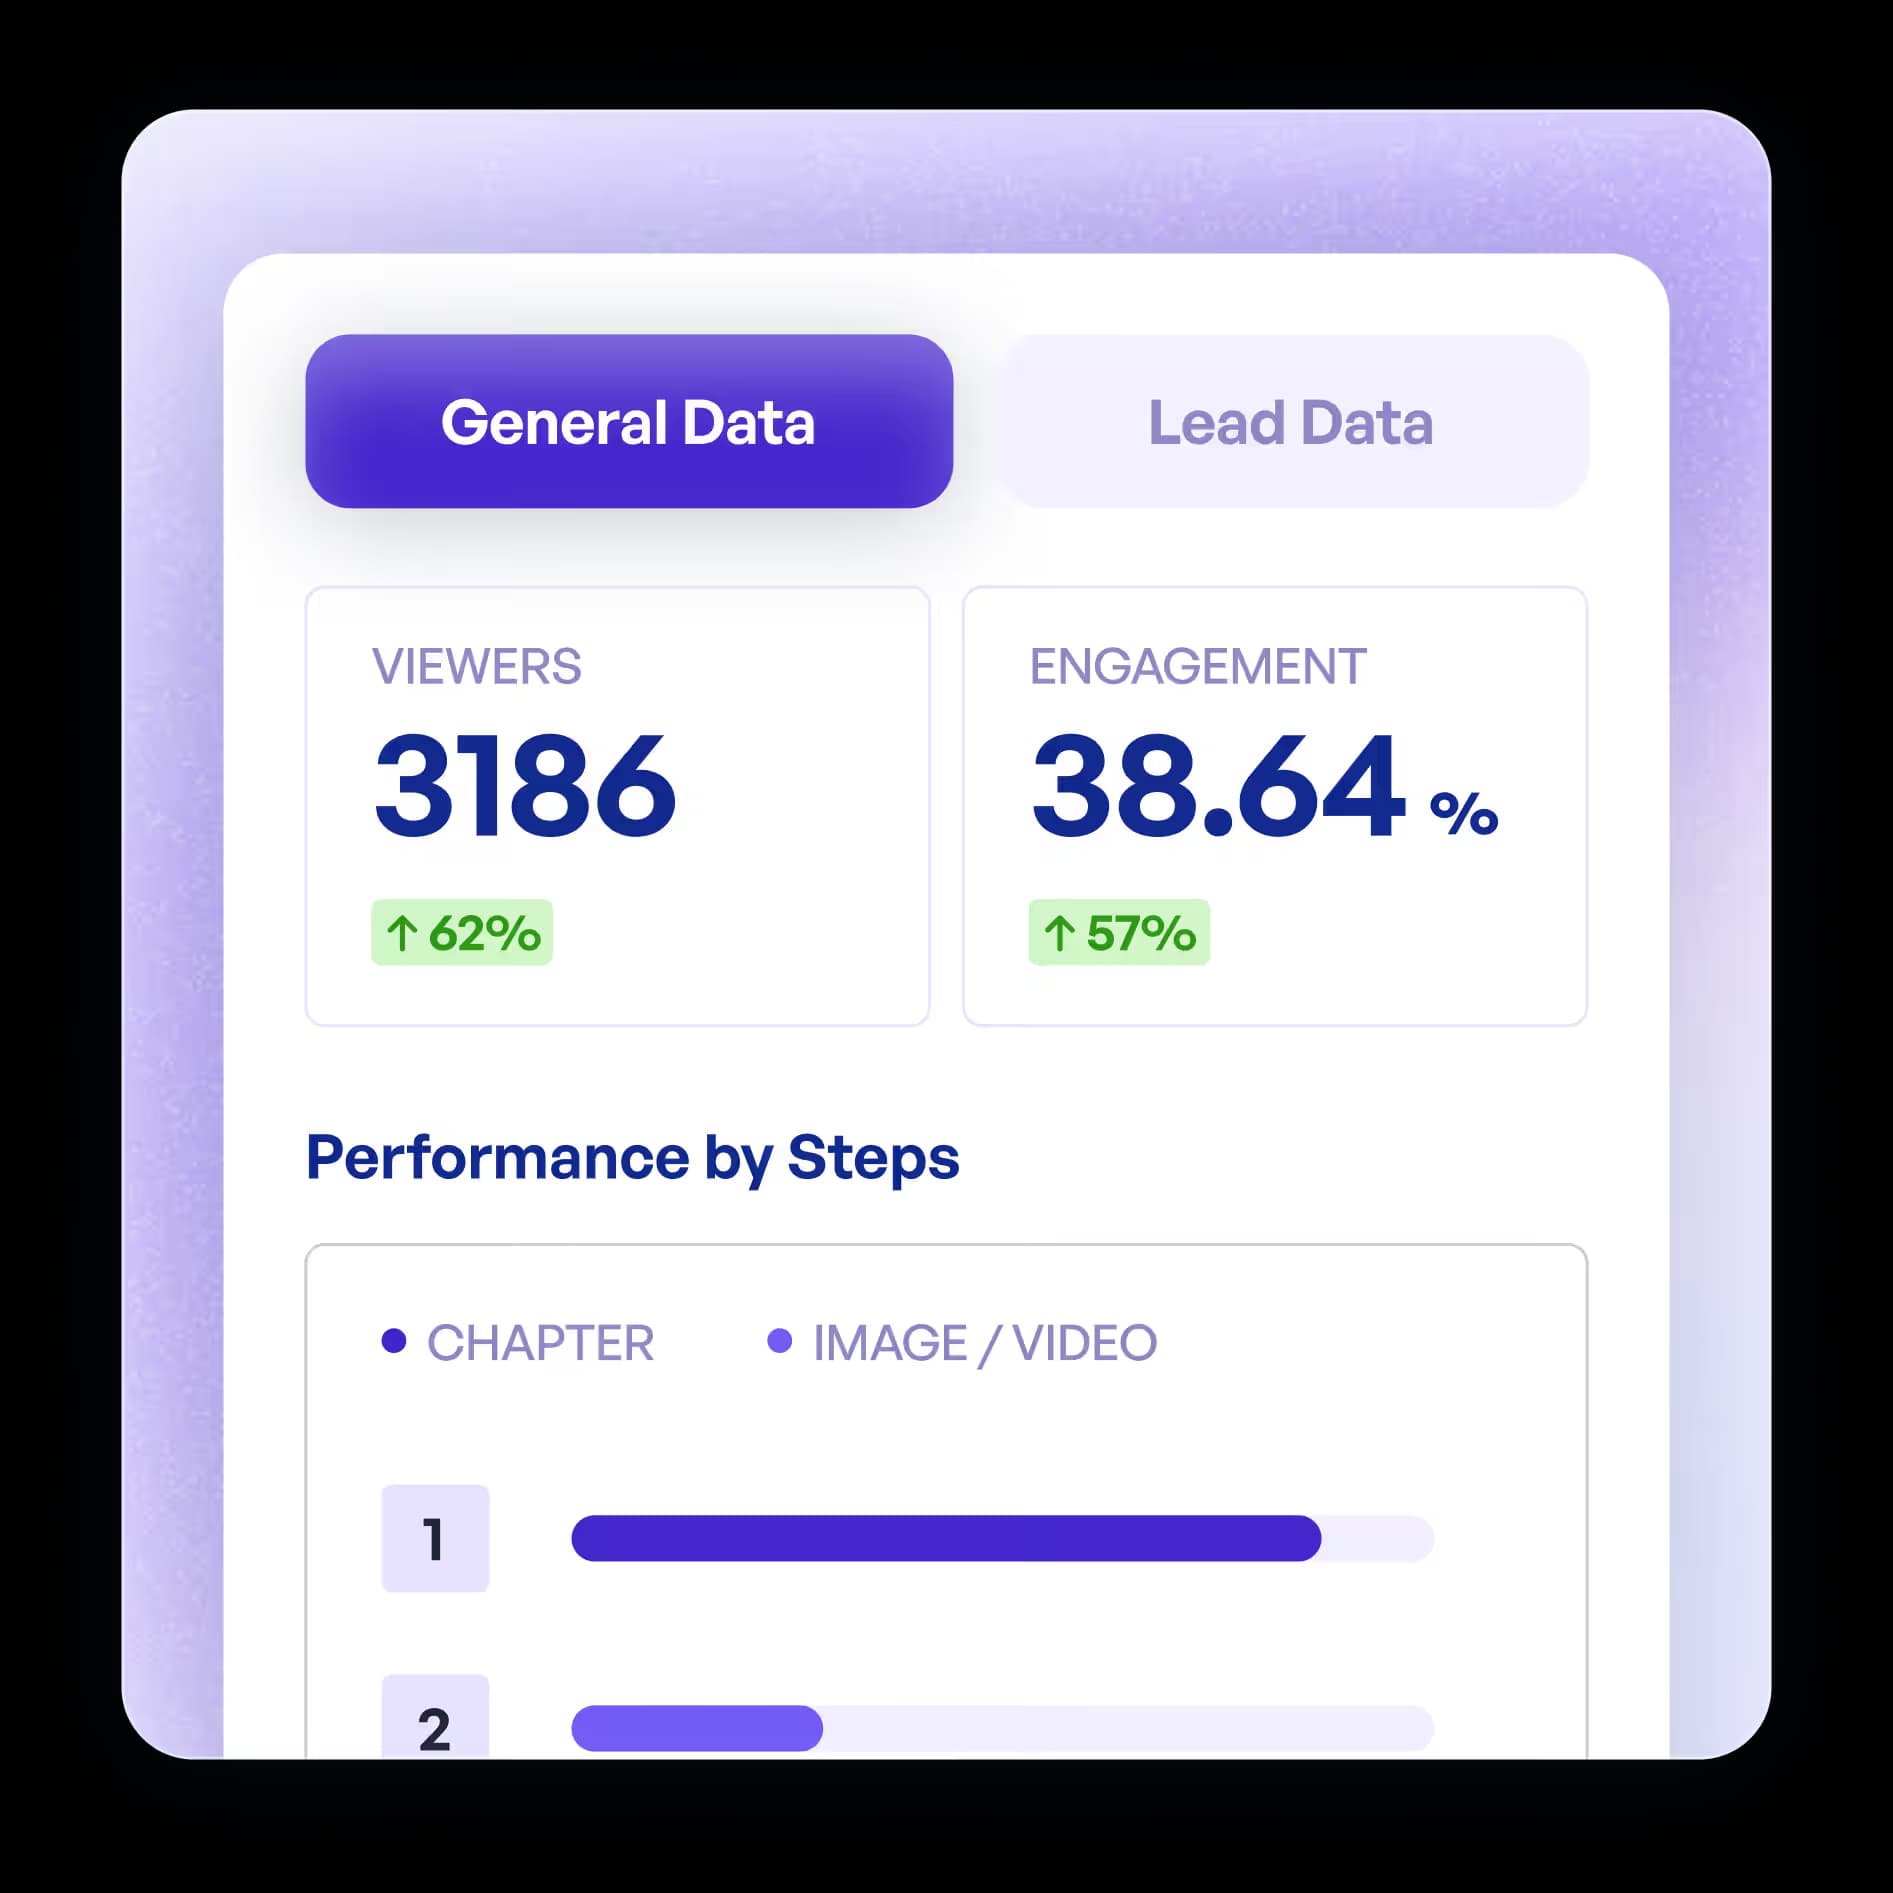
Access analytics of a specific demo you've published and discover patterns in viewer behavior, including attention span, CTA clicks, and drop-off points. Use this information to improve your demo for better completion rates.
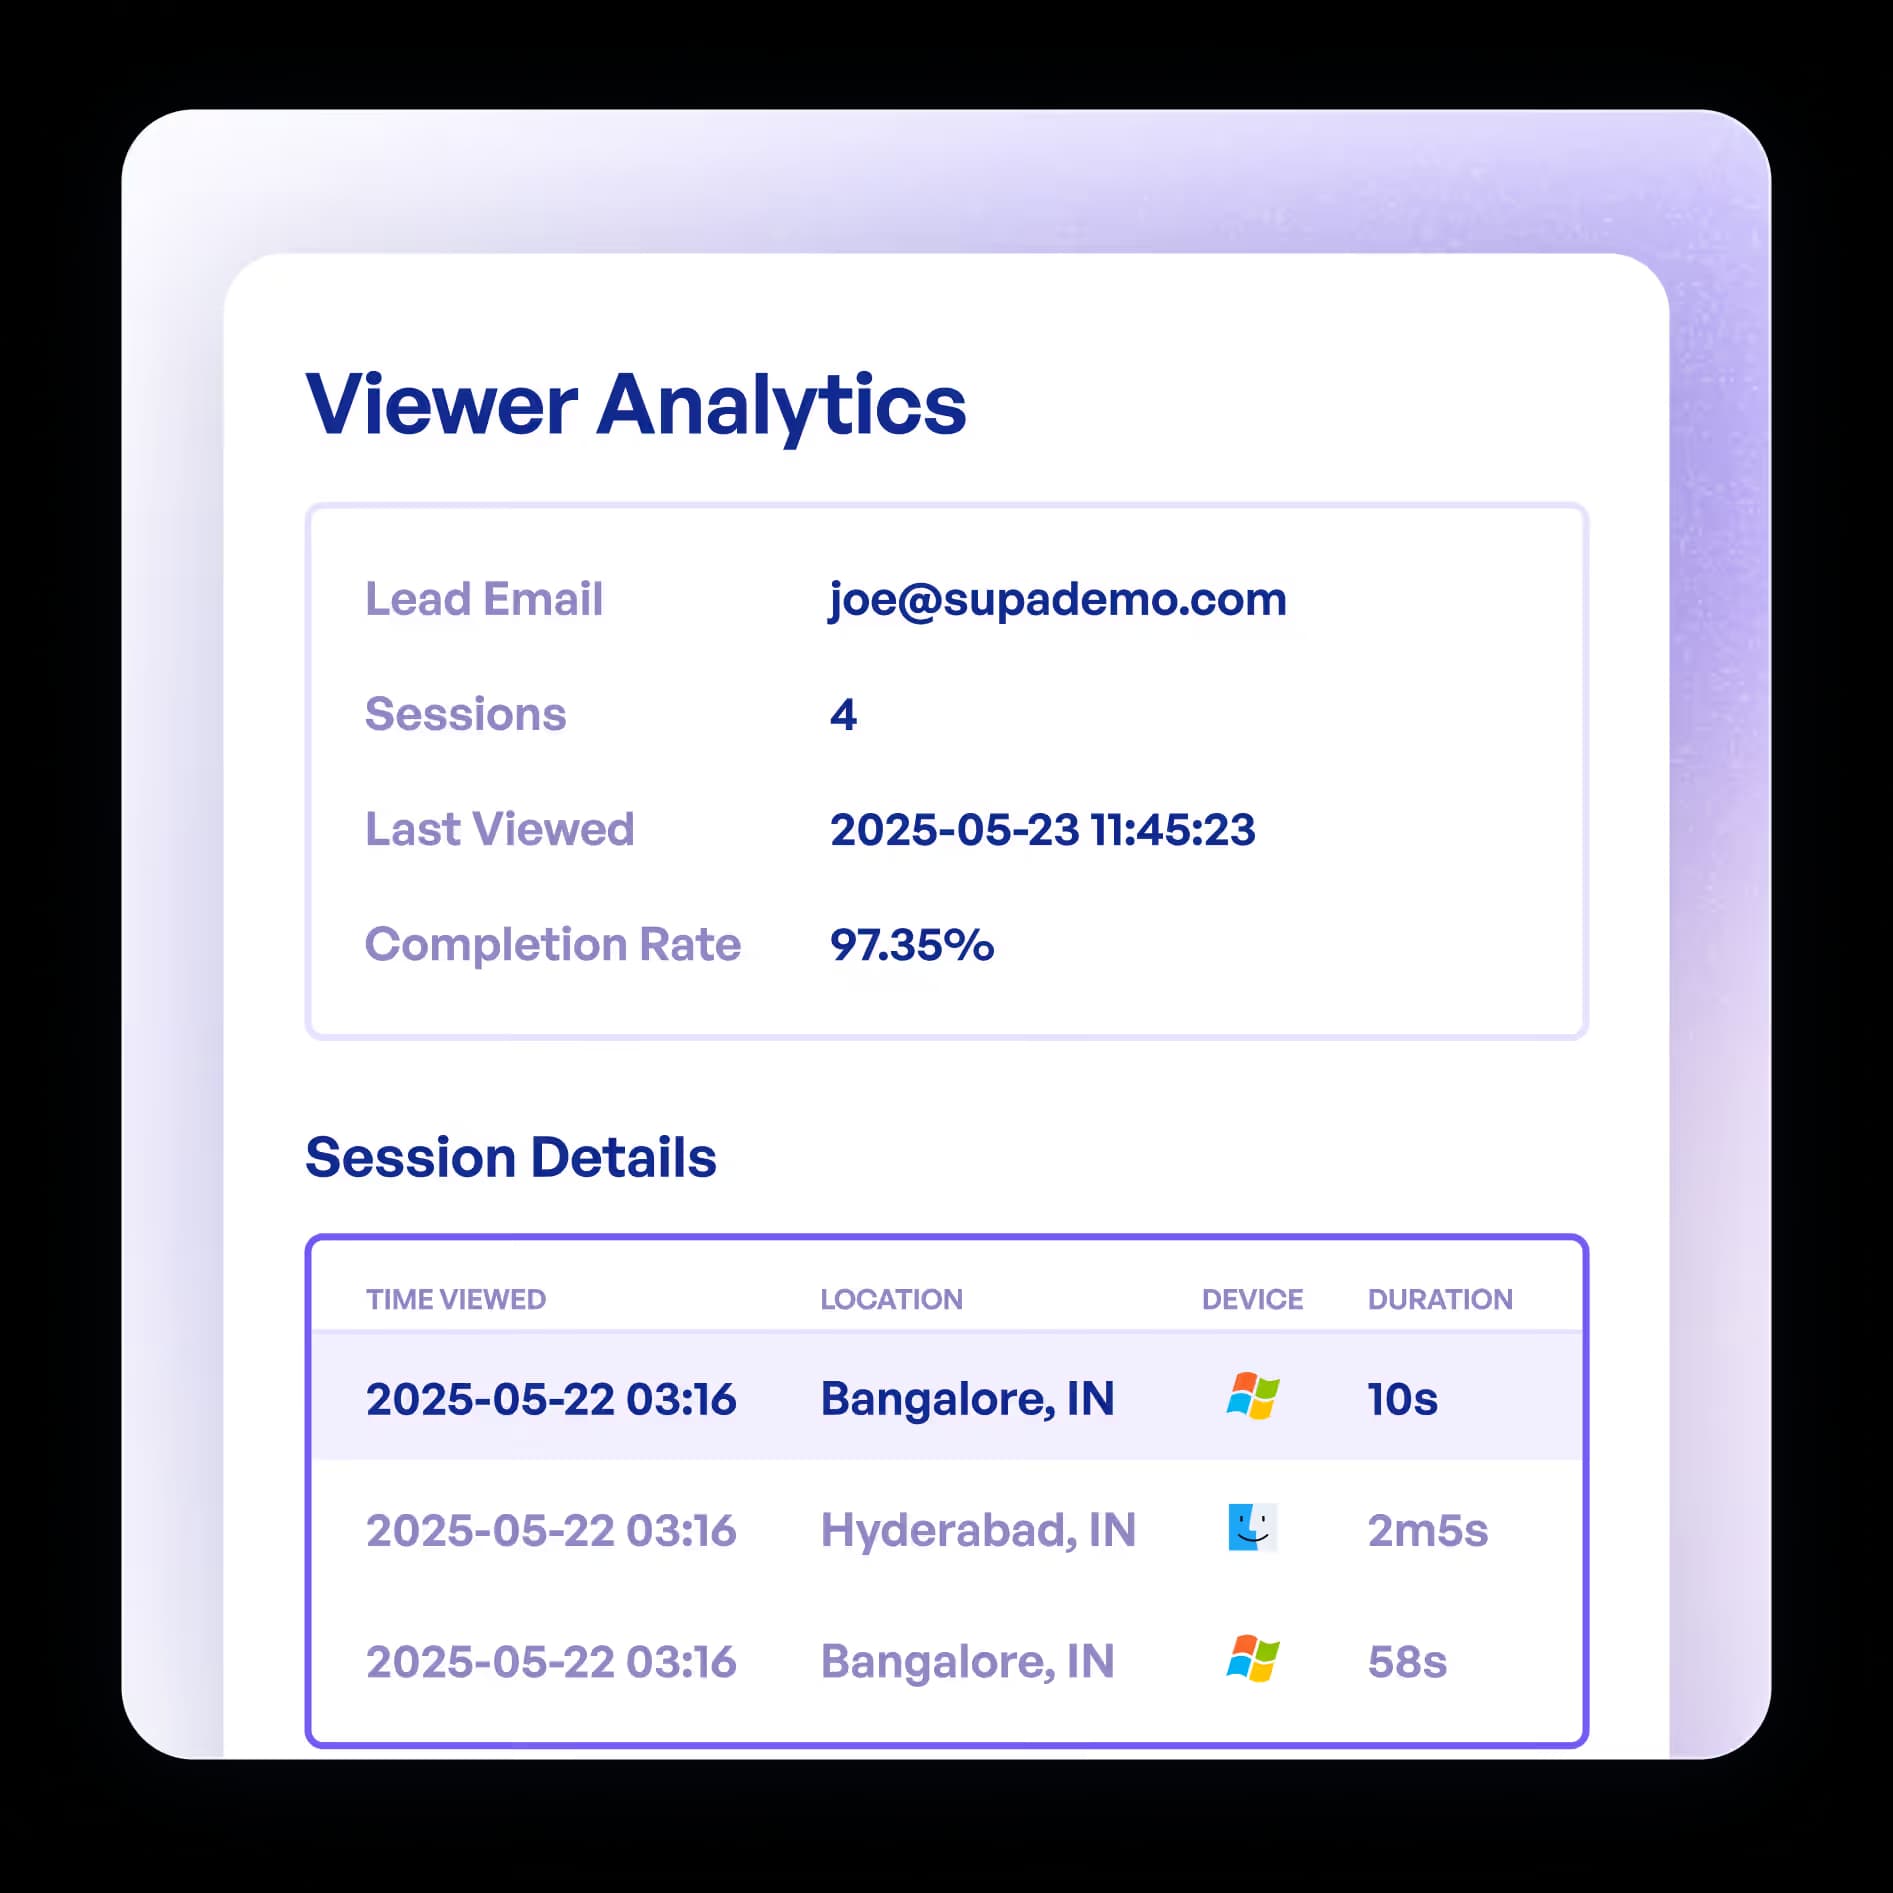
Understand how each prospect interacts with your demos for focussed marketing/sales effort analysis. Monitor individual session durations, clicks, engagement, and more.
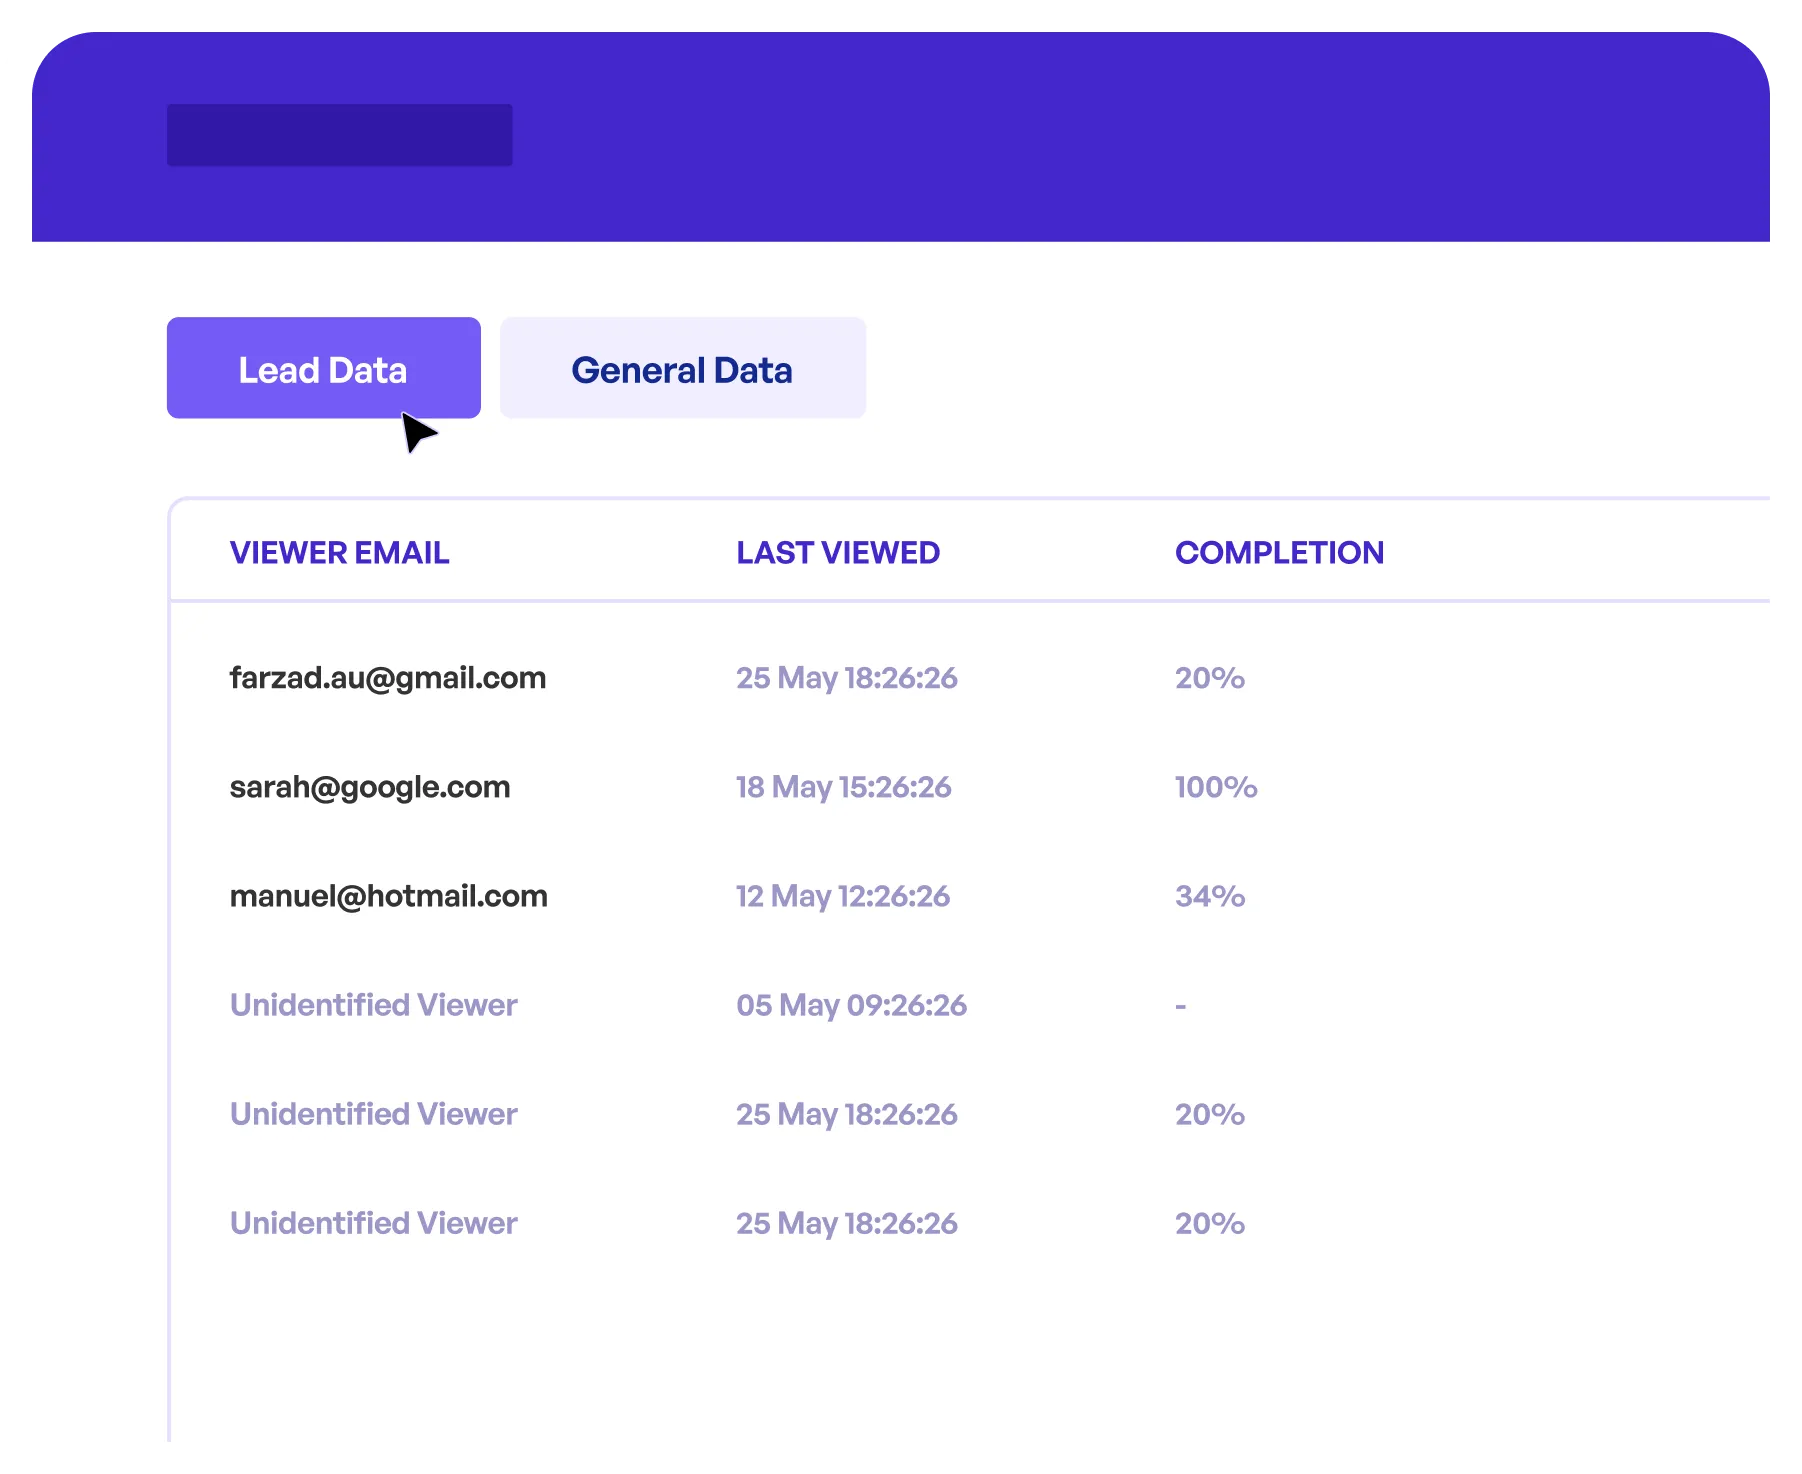
Evaluate and rank prospects based on engagement levels to focus sales efforts on the most interested leads, boosting conversion chances.

Automatically collect and sync viewer engagement data from Supademo to platforms like HubSpot, Salesforce, and Marketo, enabling teams to identify and act on highly engaged prospects.
Close more deals by pre-qualifying prospects and involving decision makers through interactive product demos.
Supademo for Sales & Enablement
Commonly asked questions about Supademo. Have other questions? Reach out and our team will be happy to help.
Supademo provides comprehensive analytics including viewer counts, average engagement rates, completion rates, session durations, CTA clicks, and drop-off points. You can track these metrics at both the workspace level (across all demos) and for individual demos to identify patterns in viewer behavior and optimize your demo strategy.
You can use engagement metrics as powerful intent signals to identify hot leads. Analyze session duration, completion rates, drop-off points, device type, and CTA clicks to classify prospect interest levels. Viewers who complete demos, spend more time, or click CTAs demonstrate higher intent and should be prioritized by your sales team.
Yes, Supademo automatically syncs viewer engagement data to platforms like HubSpot, Salesforce, and Marketo. This integration enables your sales and marketing teams to act on engagement insights directly within their existing workflow, identify highly engaged prospects, and trigger automated follow-up sequences based on demo interactions.
Workspace analytics aggregate data across your entire demo portfolio, helping you identify top-performing demos and successful strategies at a high level. Individual demo analytics focus on specific published demos, revealing detailed patterns in viewer behavior including attention span, CTA clicks, drop-off points, and completion rates for that particular demo.
Use drop-off point data to identify where viewers lose interest and optimize those steps. Monitor completion rates to gauge overall effectiveness, track CTA clicks to measure conversion intent, and analyze session durations to understand engagement depth. Compare metrics across demos to identify what content resonates best with your audience.