Overview:

Efficiently manage your projects in Airtable by creating Gantt view charts. Organize tasks, enhance user experience, and simplify navigation with this guide on implementing Gantt charts. The seamless process outlined empowers you to visualize project timelines, improving efficiency and clarity in project management within the Airtable platform.

Who is Airtable best suited for?

Airtable is best suited for a wide range of professionals, including Project Managers, Event Planners, and Content Creators. For example, Project Managers can use Airtable for organizing tasks, tracking project progress, and managing workflows, Event Planners can leverage it for coordinating event details and tracking vendor information, and Content Creators can use it for planning and managing content calendars, all benefiting from Airtable’s flexible database and collaborative features.

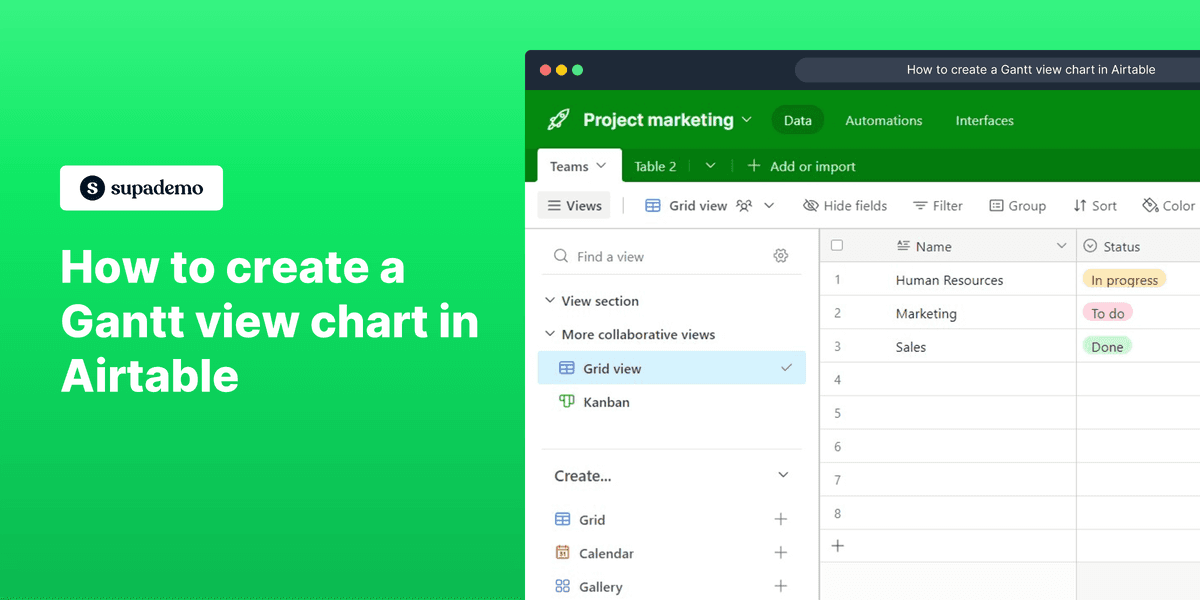
How to create a Gantt view chart in Airtable

1. Start by selecting 'Add More' to begin your Gantt chart.

1 Click on "Add…"

2. Next, click on 'GanttView' to define your chart's structure.

2 Click on "Gantt
View each..."

3. Now, select all relevant fields for your data.

3 Upload

4. Add necessary fields, then confirm your entries.

4 Upload

5. Toggle the milestone option on, then proceed further by clicking 'Continue'.

5 Upload

6. Finally, you've successfully created your Gantt view chart!

6 Upload

Common FAQs on Airtable

How do I create and manage a base in Airtable?

To create a base, log in to your Airtable account and click on the “+ Add a base” button on your workspace homepage. You can start from scratch, use a template, or import data from a spreadsheet. Once your base is created, you can add tables to organize your data, customize fields (e.g., text, numbers, dates, attachments), and set up views (e.g., grid, calendar, gallery) to visualize your information. Manage your base by adding, editing, and deleting records, and use Airtable’s collaboration features to share and work on your base with team members.

How can I use Airtable’s views to organize and filter data?

Airtable offers various views to help you organize and filter your data effectively. To create a view, open your base and click on the “+” button next to the view options. You can choose from grid view, calendar view, gallery view, or kanban view. Each view allows you to customize how data is displayed and filtered. For example, in grid view, you can sort and filter records based on field values, while in calendar view, you can visualize records with date fields on a calendar. Use these views to tailor the display of your data to suit different needs and perspectives.

How do I automate tasks and integrate Airtable with other tools?

To automate tasks in Airtable, use the “Automations” feature. Click on the “Automations” tab in your base, and set up triggers and actions based on events in your base (e.g., when a record is updated, when a new record is created). You can configure actions such as sending notifications, creating records, or updating fields. For integrations, go to the “Apps” section and select “+ Add an app” to browse and install apps that connect Airtable with other tools (e.g., Slack, Google Drive, Zapier). You can also use Zapier or Integromat to create custom workflows and automate processes between Airtable and hundreds of other applications.

Create your own step-by-step demo

Scale up your training and product adoption with beautiful AI-powered interactive demos and guides. Create your first Supademo in seconds for free.

Get the fastest, easiest interactive demo platform for teams

Sign up