

Overview:
Streamline your data management in Airtable by creating insightful dashboards effortlessly. Enhance your user experience and simplify navigation by incorporating relevant elements for easy data interpretation. This comprehensive guide walks you through the seamless process of designing and utilizing dashboards in Airtable, empowering you to optimize data visualization and improve clarity in your projects within the Airtable platform.
1. Start by selecting 'Add More.'
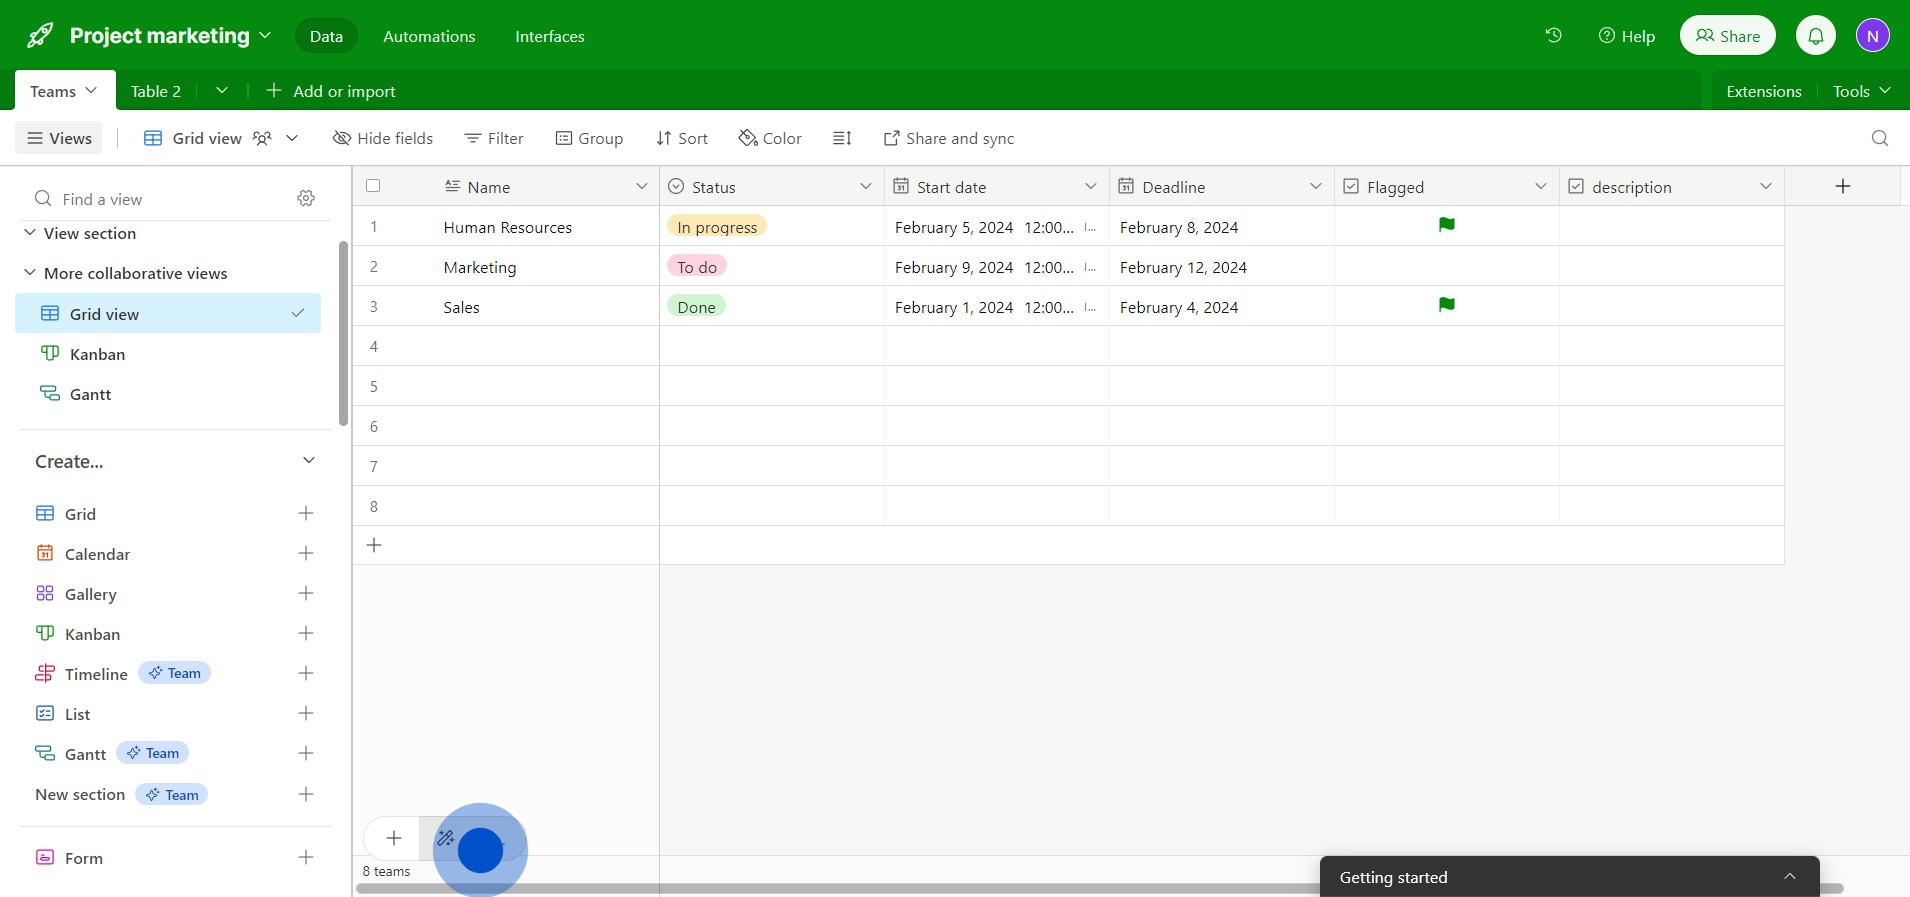
2. Next, navigate to 'Dashboard'.
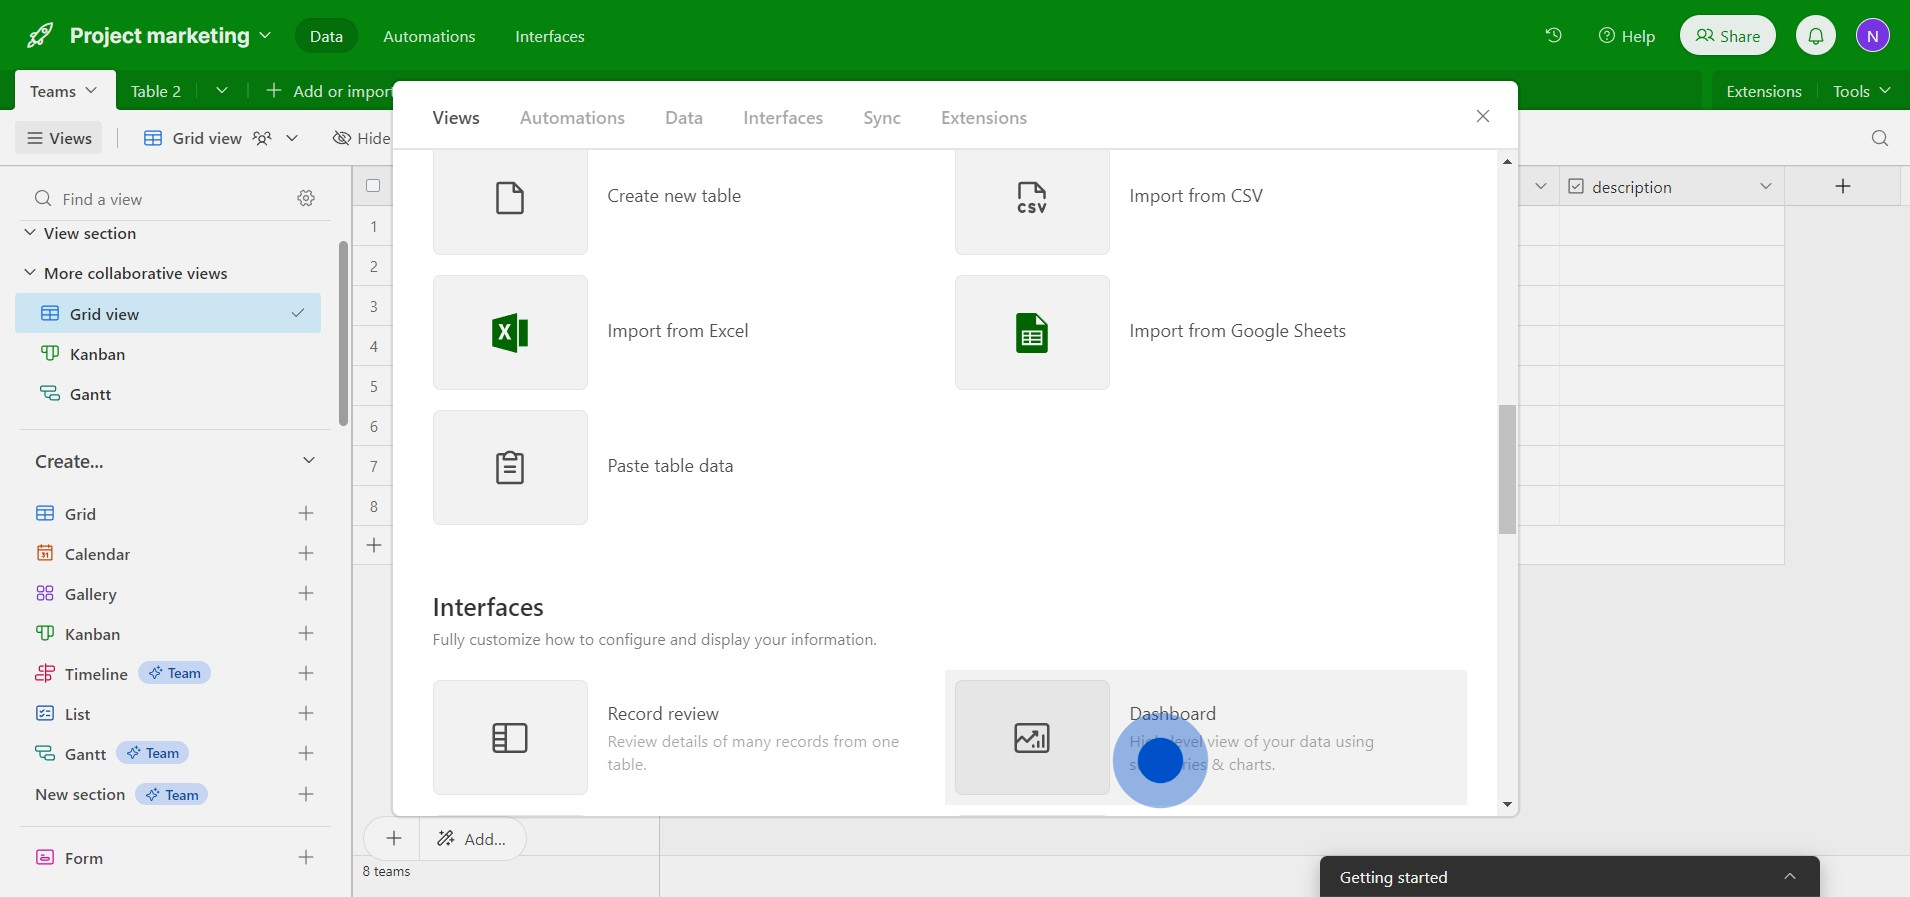
3. Then, advance by clicking 'Next'.
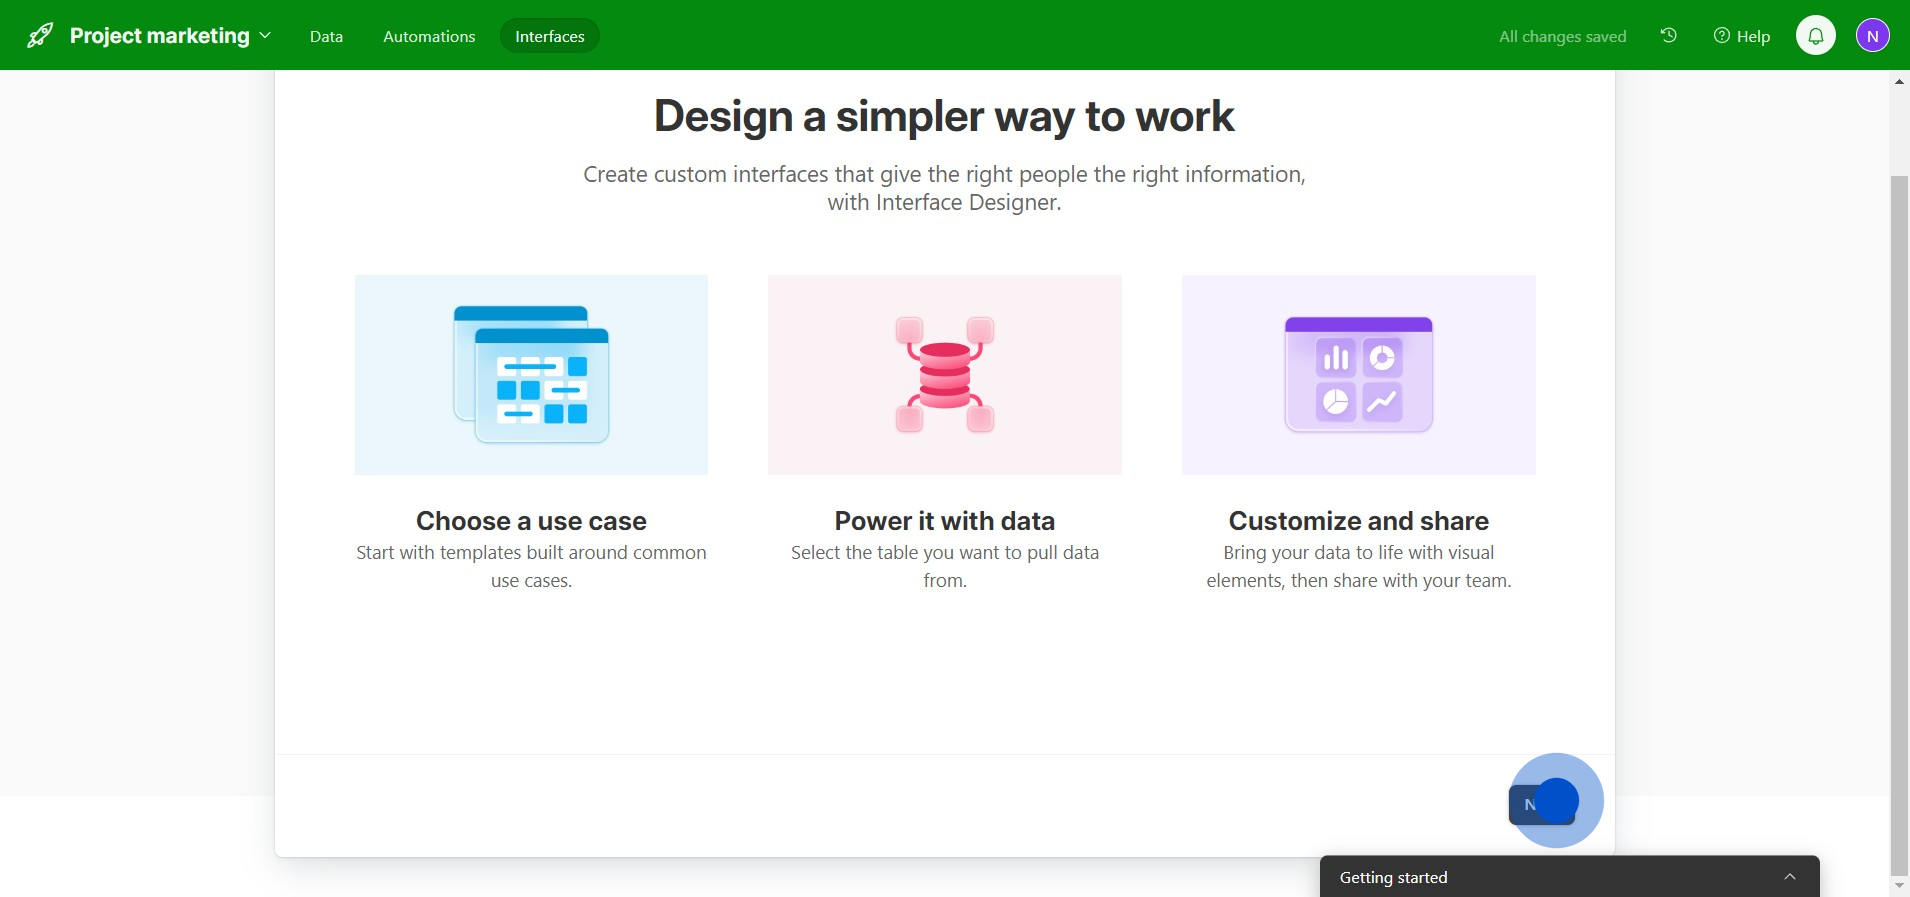
4. Continuing, select 'Next' once again.
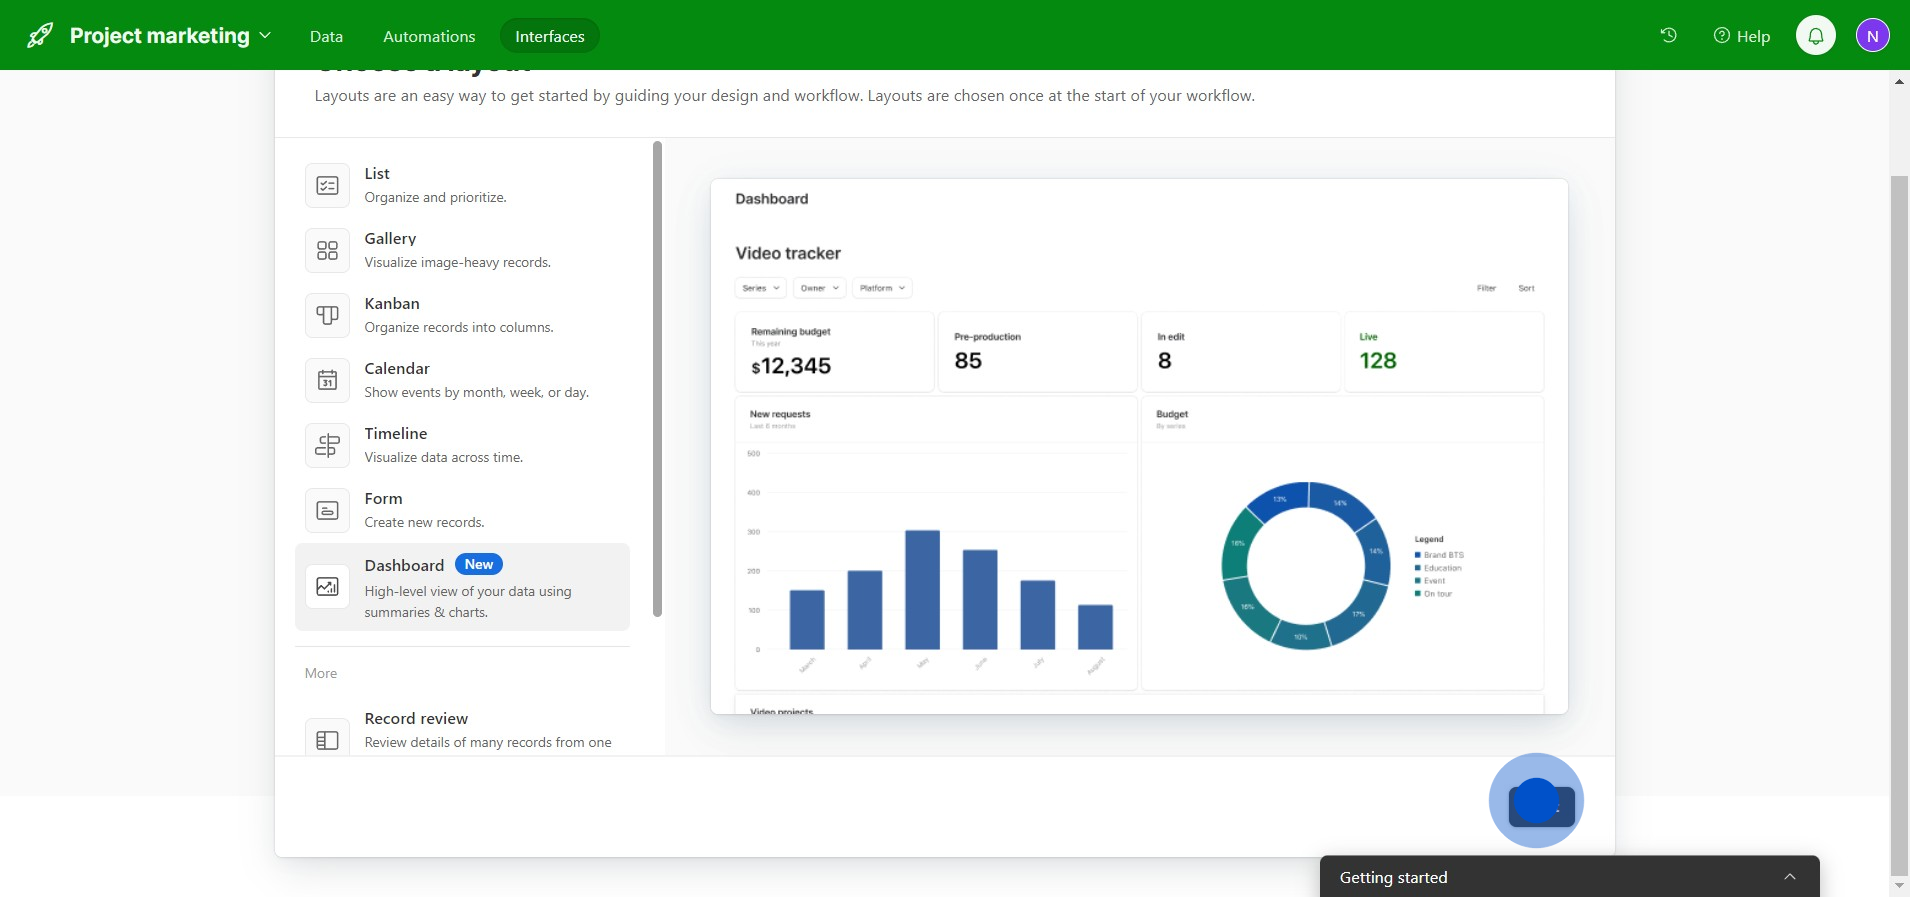
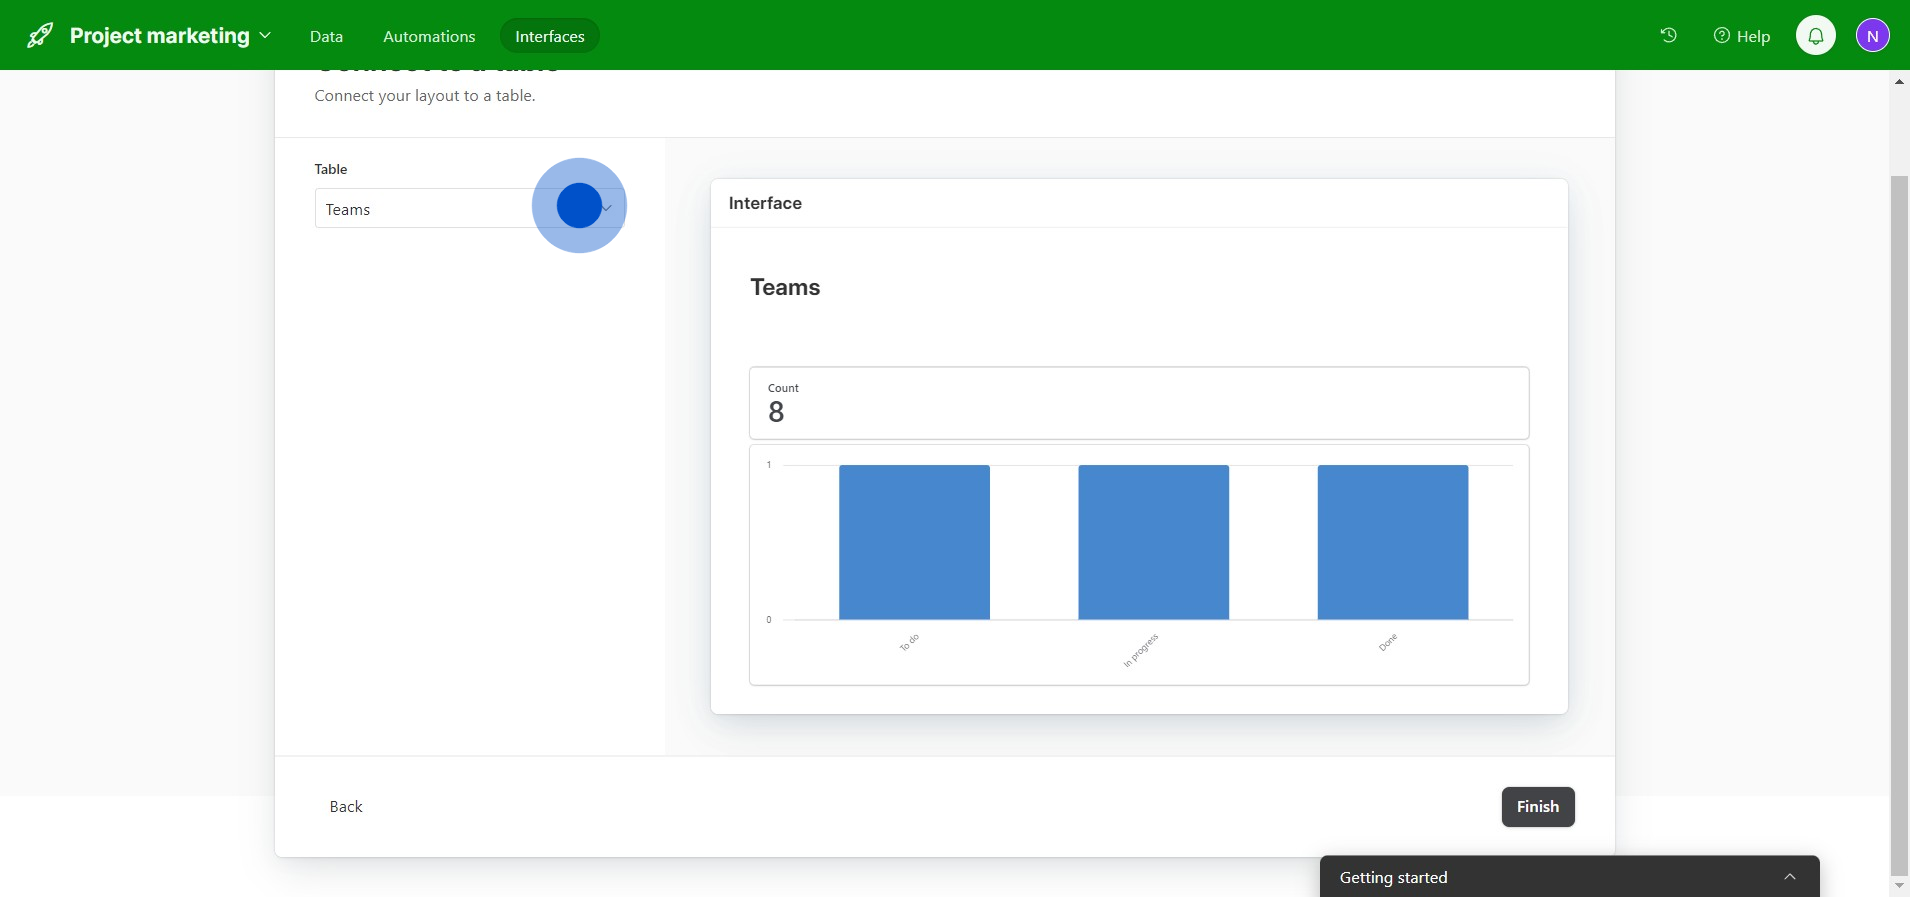
5. Subsequently, pick a table from the 'Teams' section.
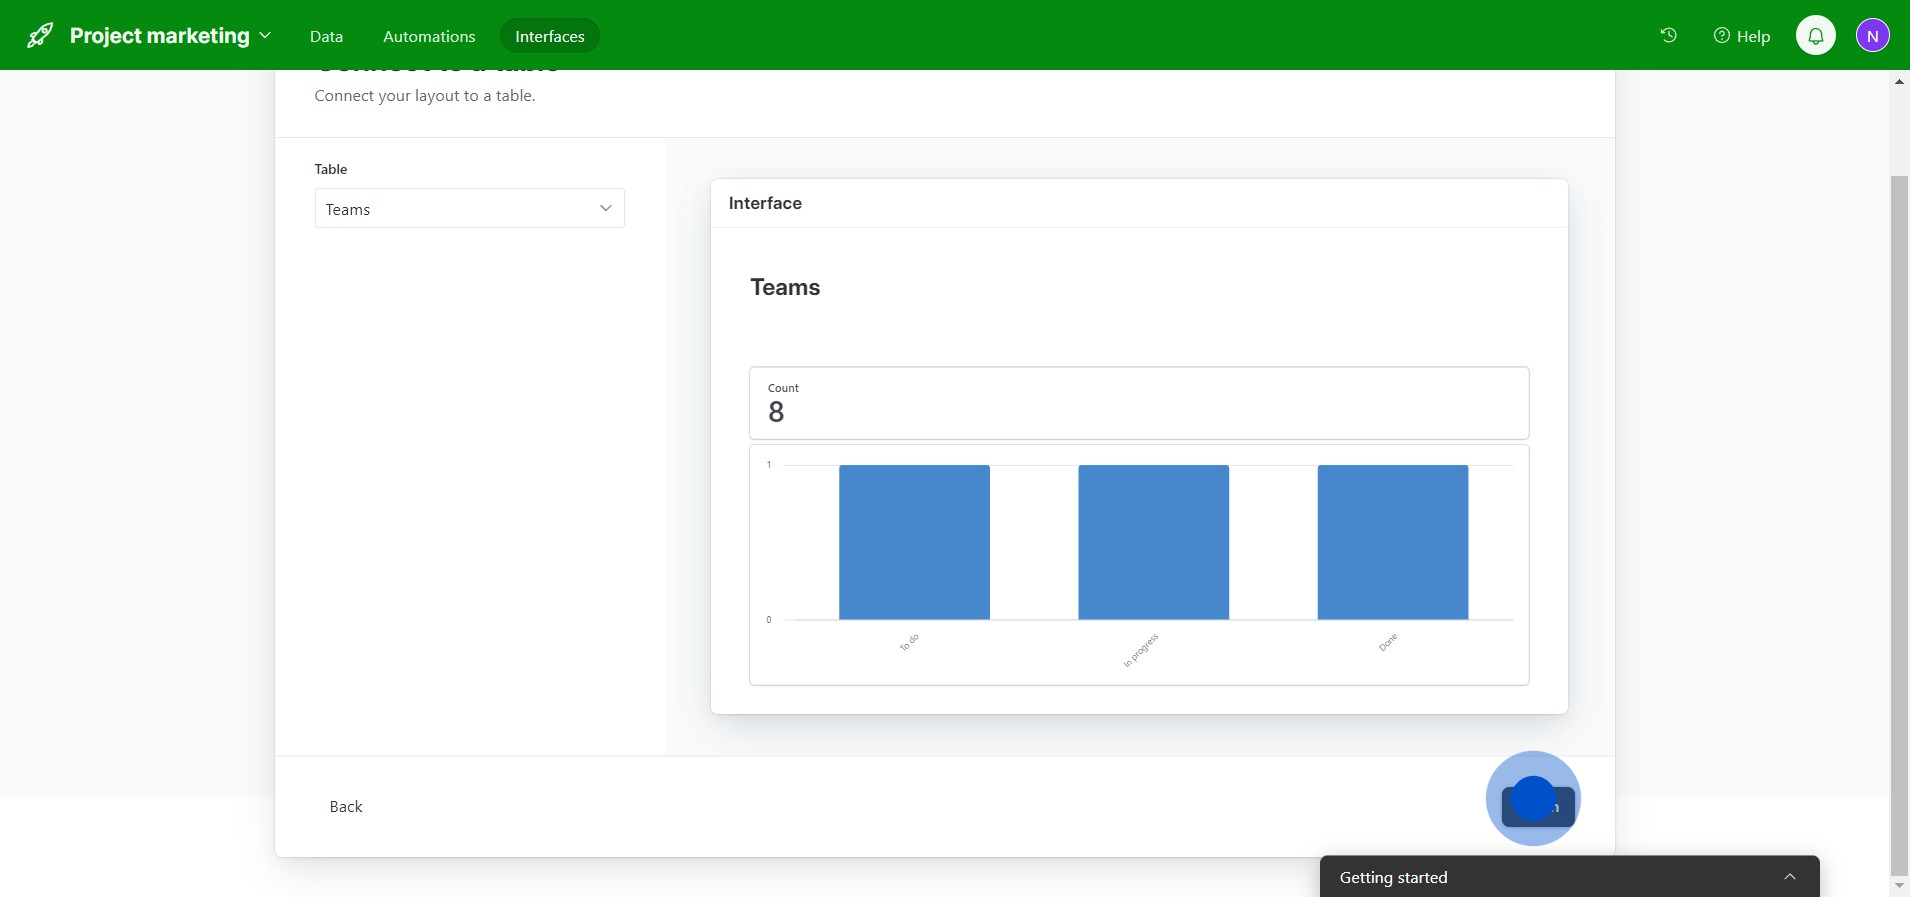
6. Afterwards, finalize by pressing 'Finish.'
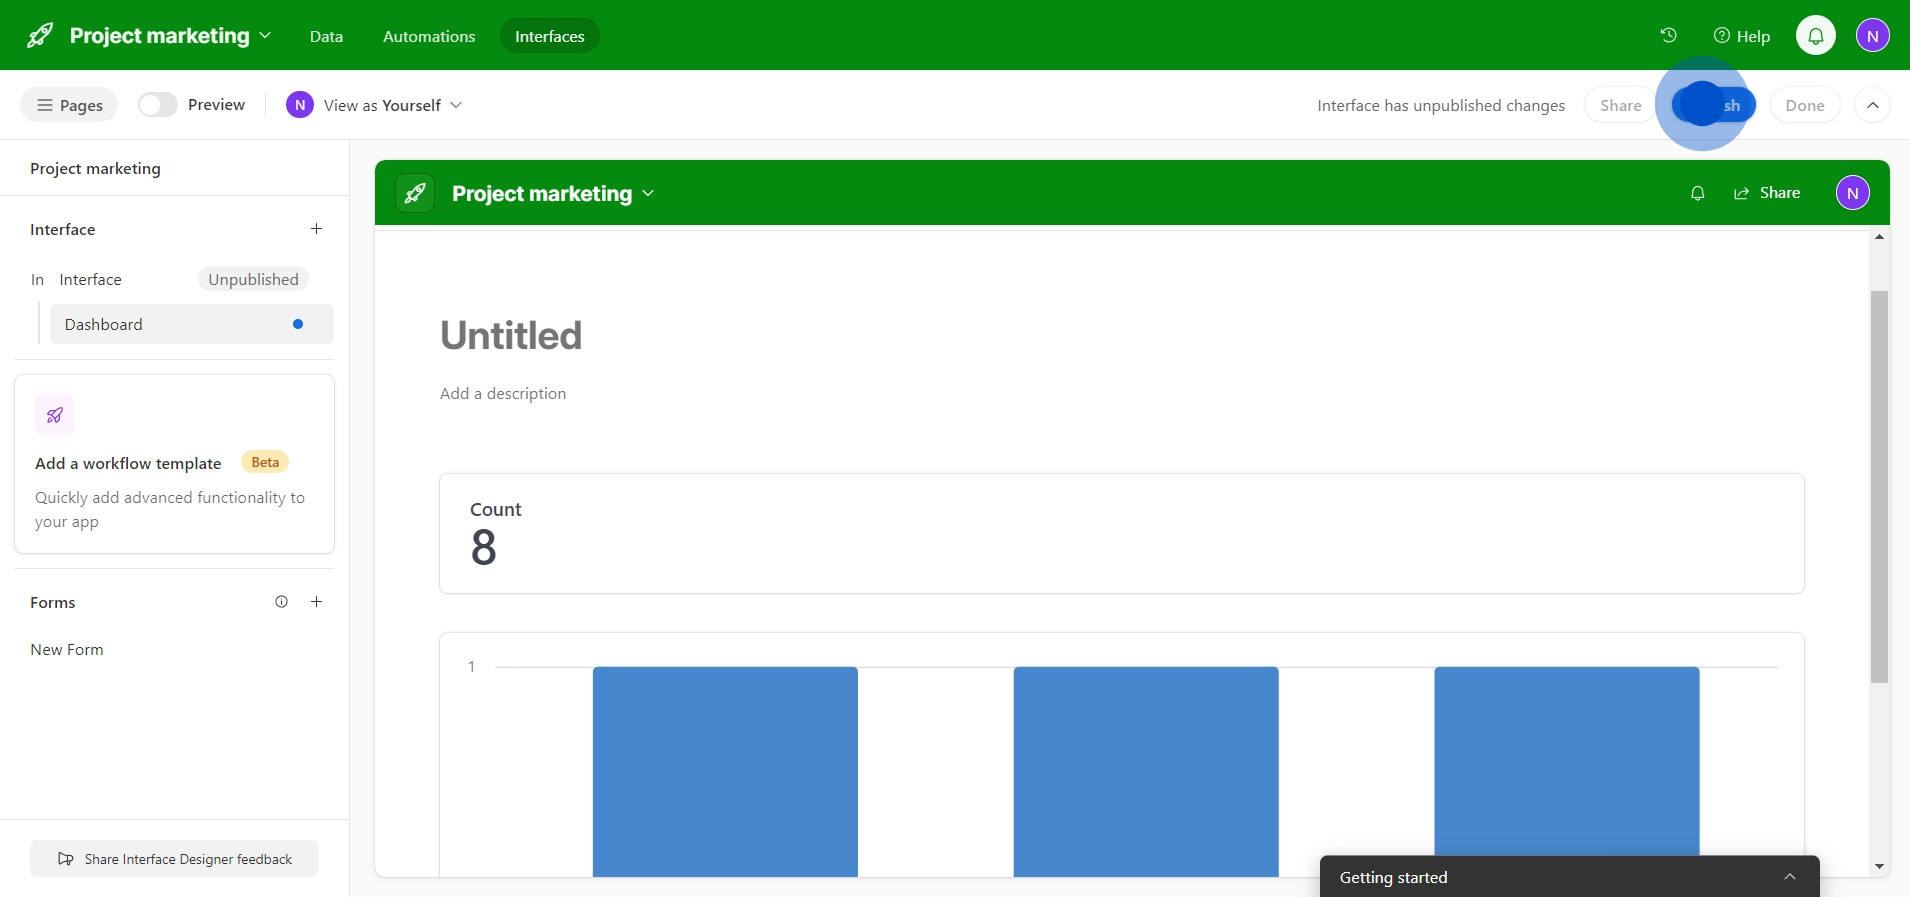
7. Next, get it live by choosing 'Publish.'
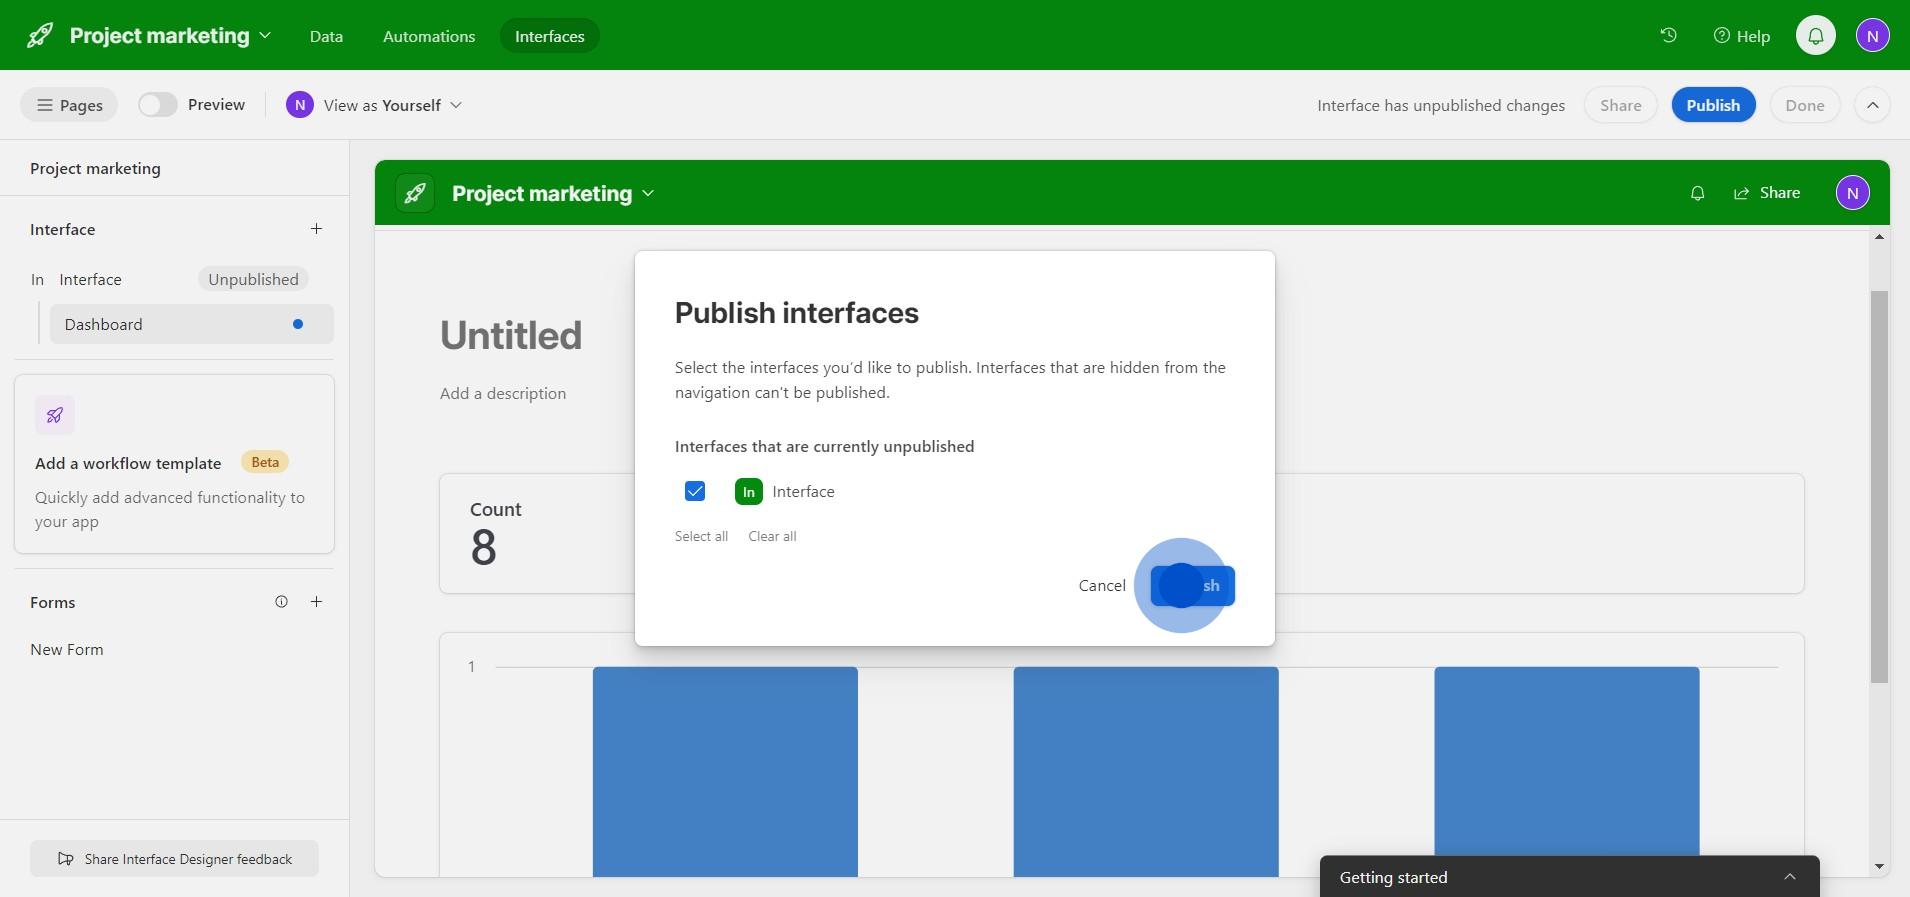
8. After that, reinforce your action by clicking 'Publish' again.
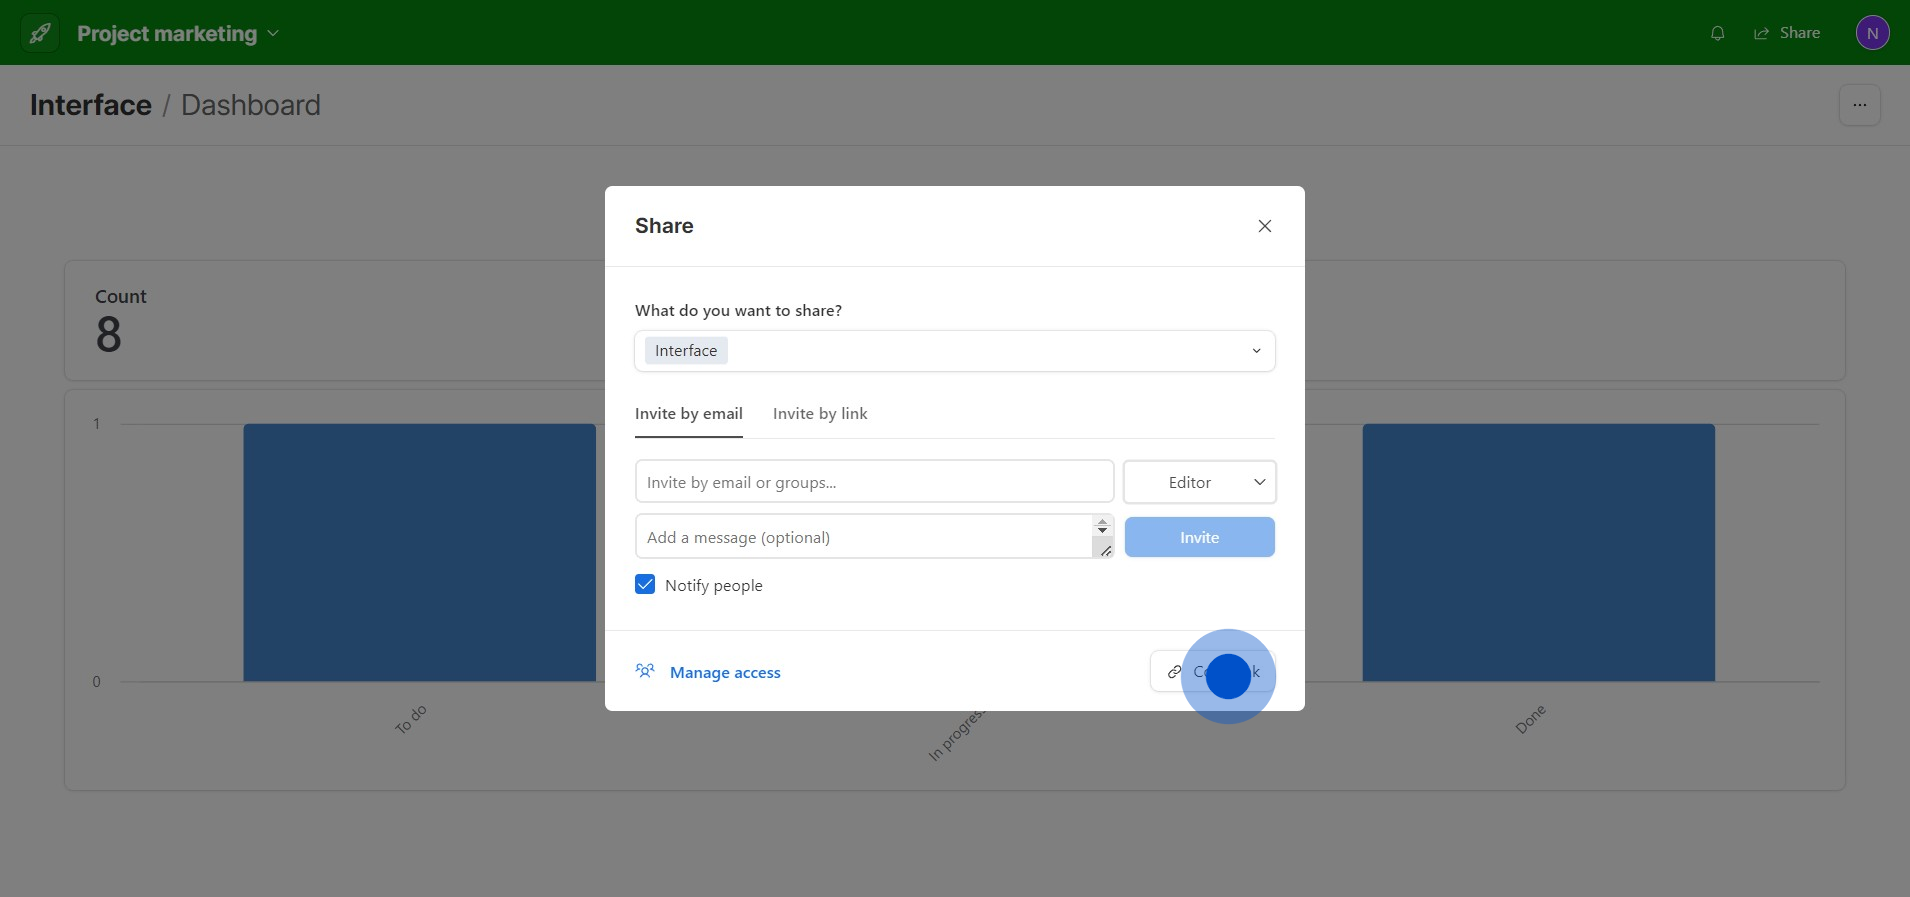
9. Now, it's time to spread the word, tap on 'Share.'
10. Finally, generate a sharing link by selecting 'Copy link'.
Create your own step-by-step demo
Scale up your training and product adoption with beautiful AI-powered interactive demos and guides. Create your first Supademo in seconds for free.