

Overview:
Elevate your data visualization in Pendo by creating impactful dashboards that enhance your analytical capabilities. This comprehensive guide offers a step-by-step process to efficiently design and implement dashboards, empowering you to organize and present key metrics with clarity. Improve your user experience, streamline data interpretation, and optimize decision-making within the Pendo platform. This guide ensures a seamless journey in crafting informative dashboards that boost efficiency and provide a clear snapshot of your data landscape.
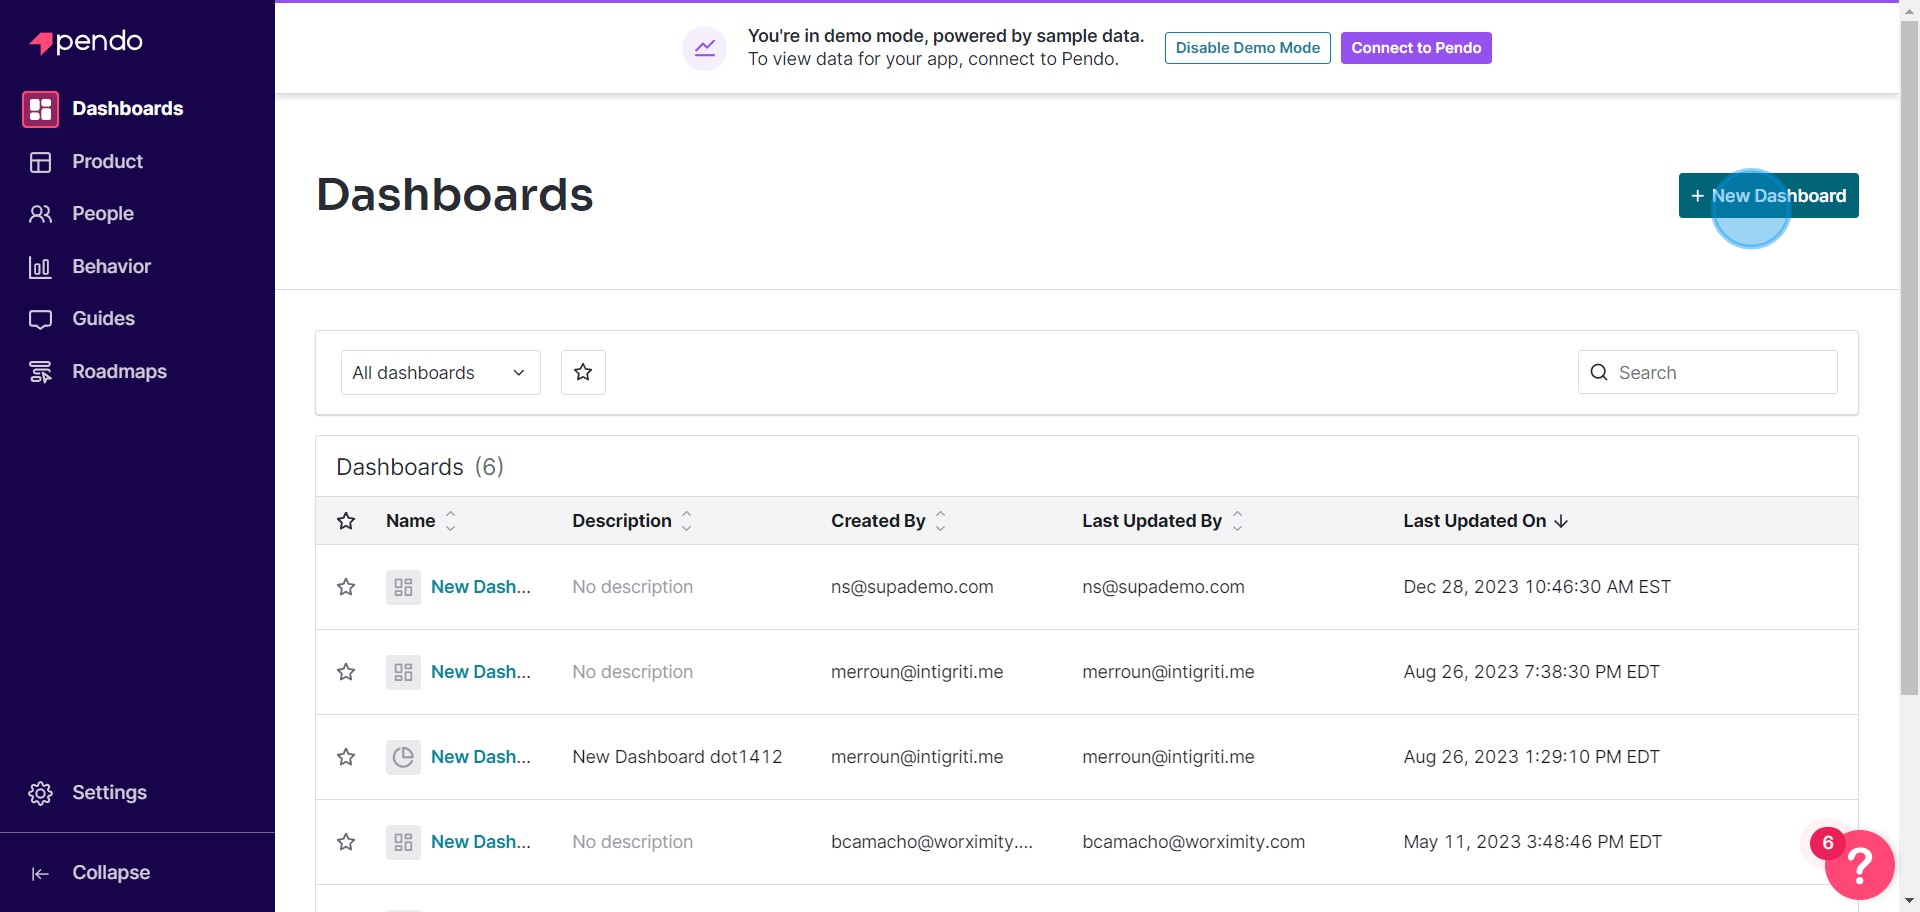
1. Click 'New Dashboard' to begin dashboard creation.
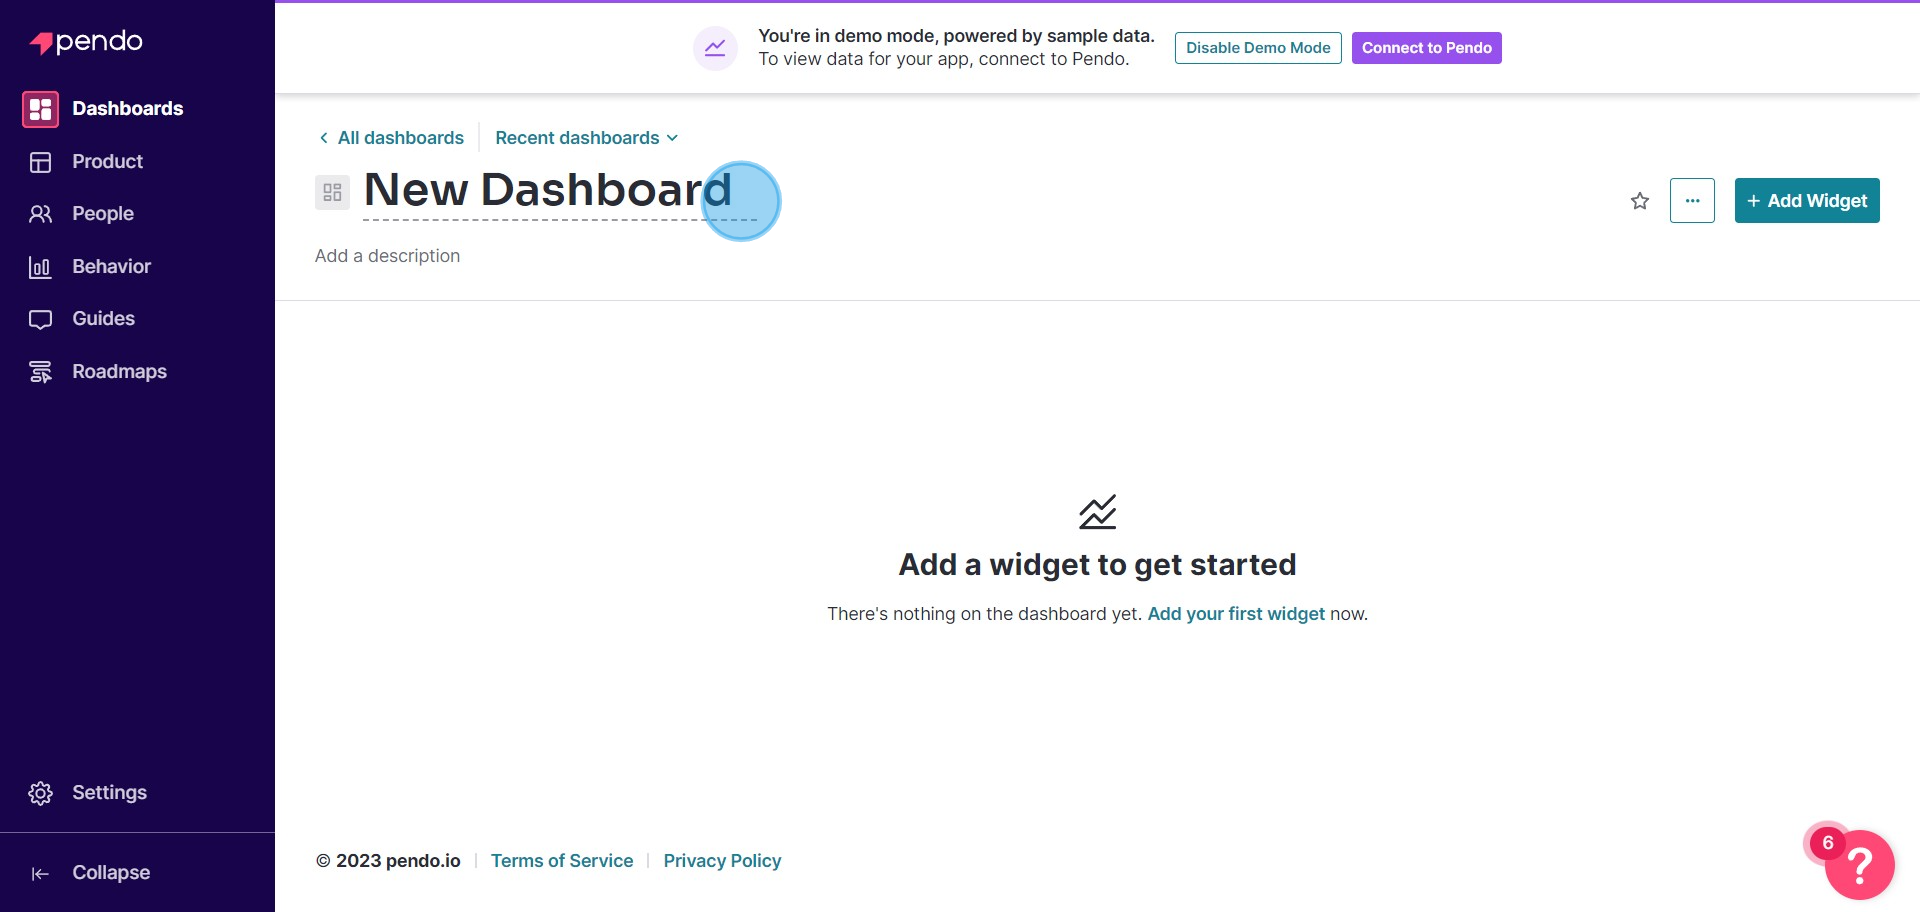
2. Enter the name of your new dashboard in the highlighted area.
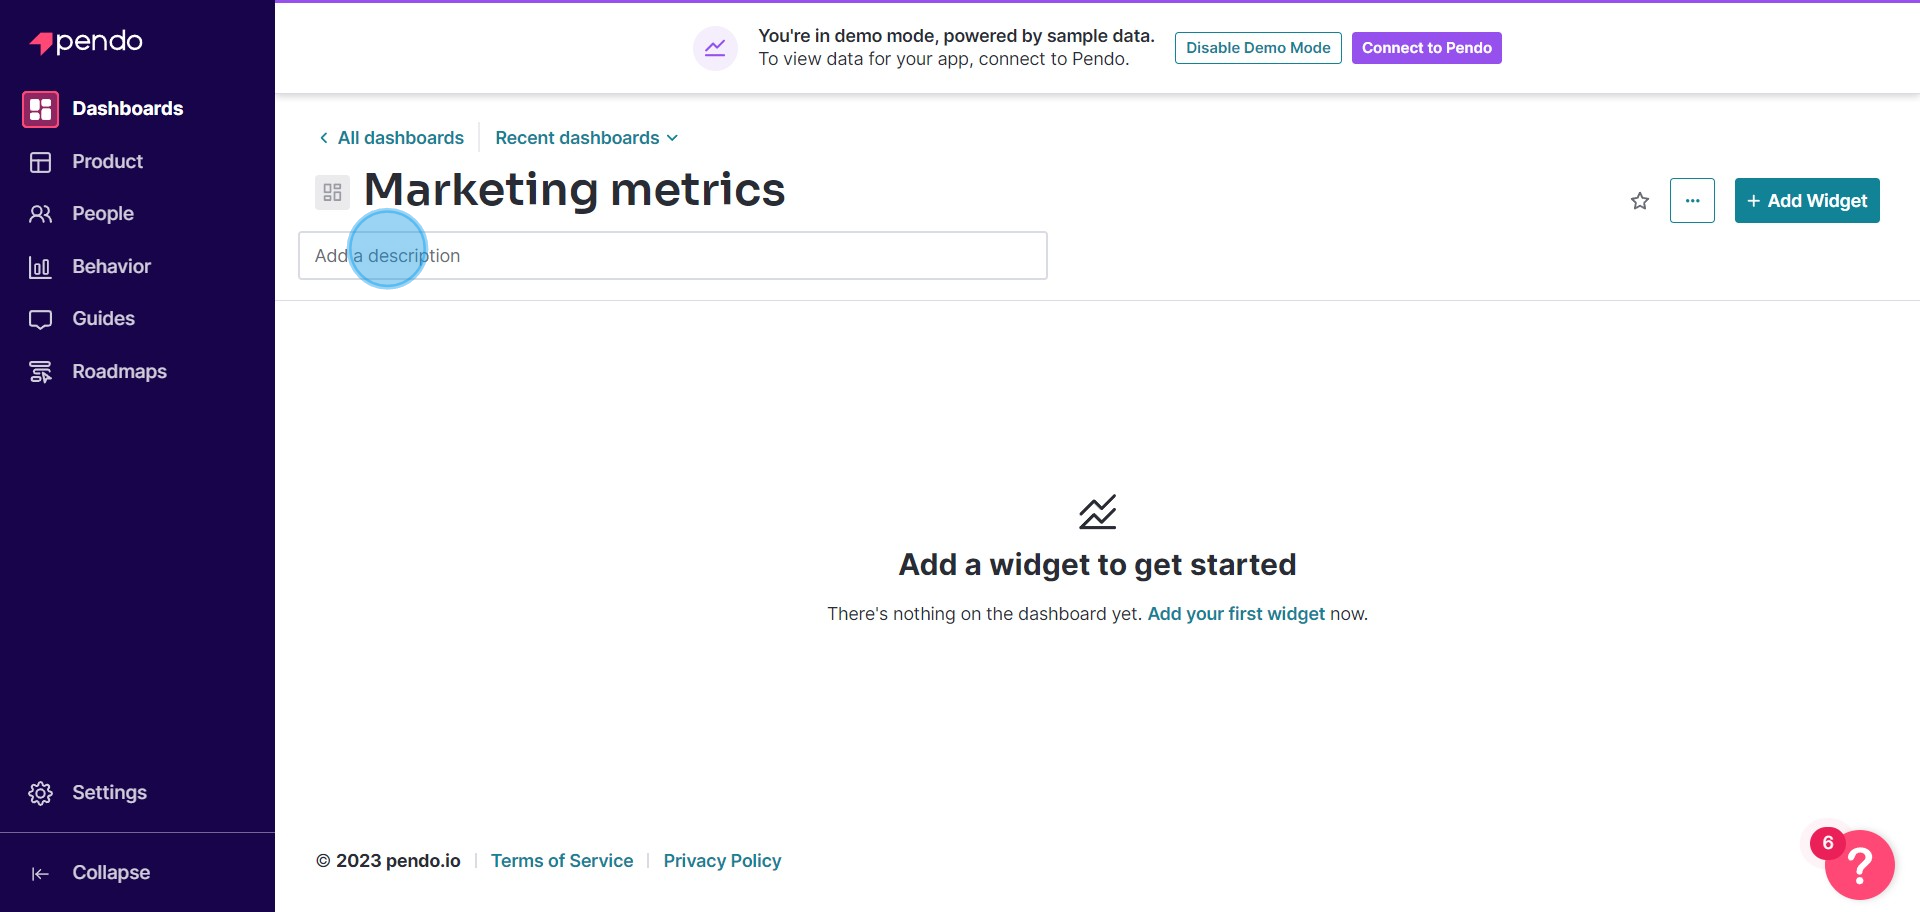
3. Click 'Add a description' to provide context to your dashboard.
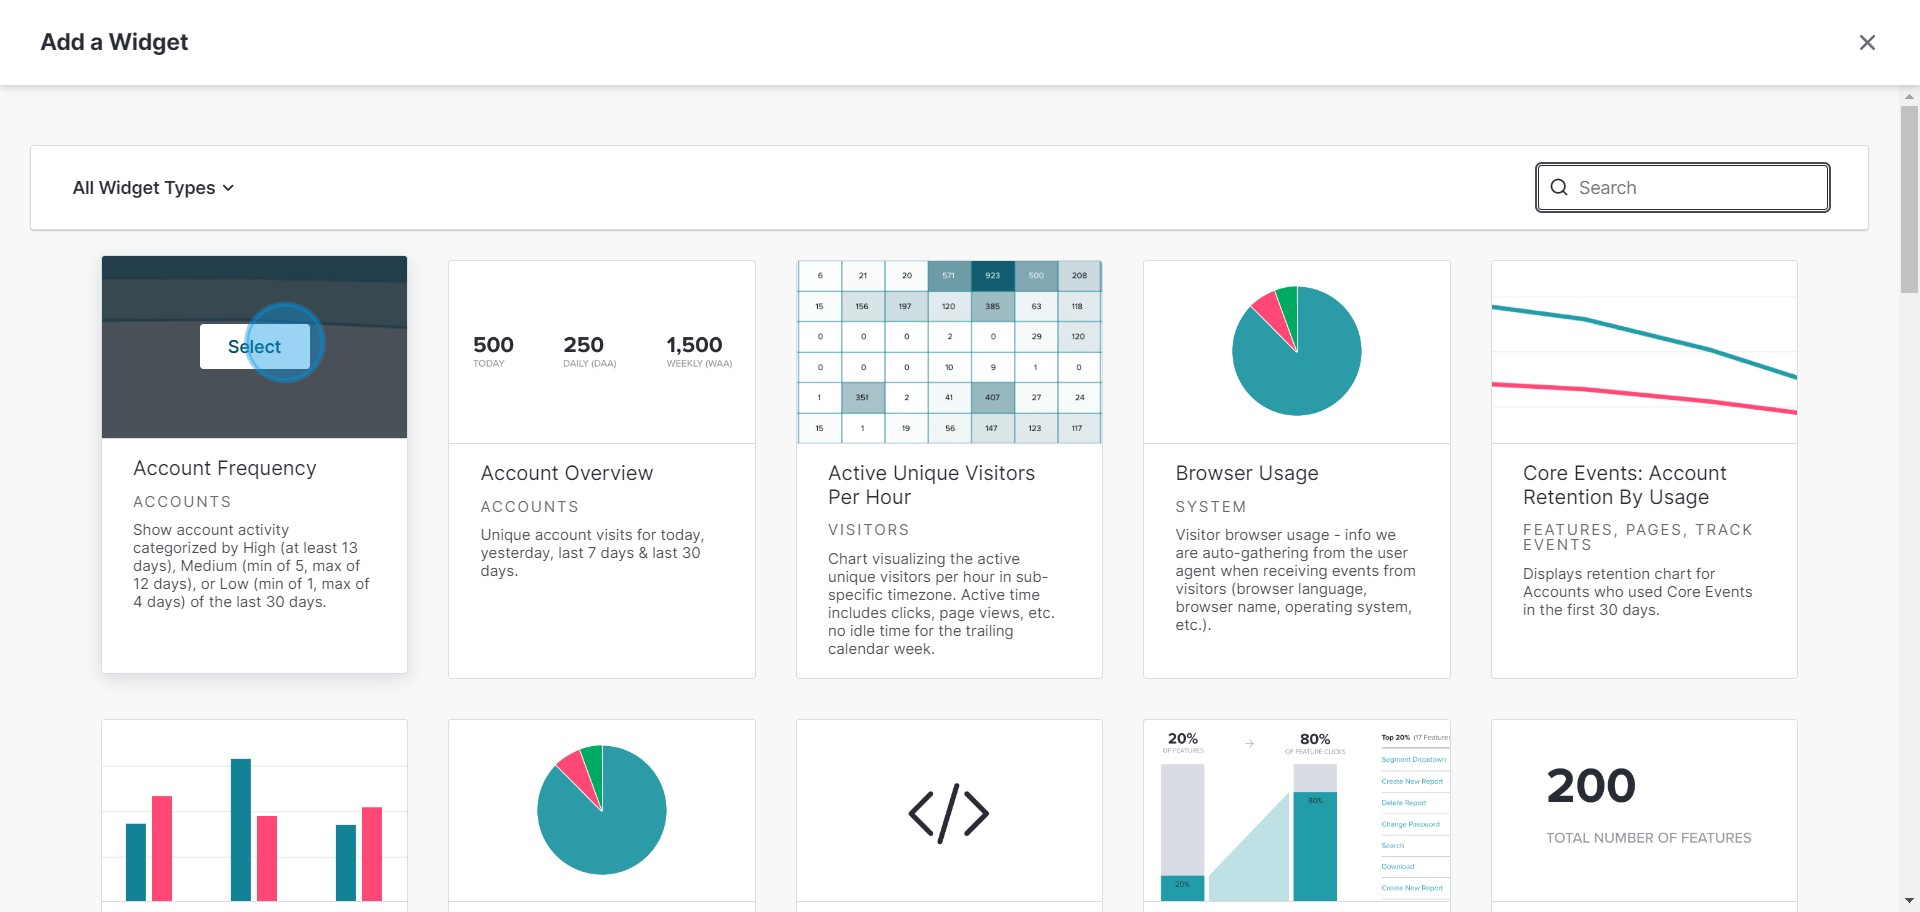
4. Click 'Add Widget' to add a tracking overview to your dashboard.

5. Select a widget type to further customize your dashboard view.
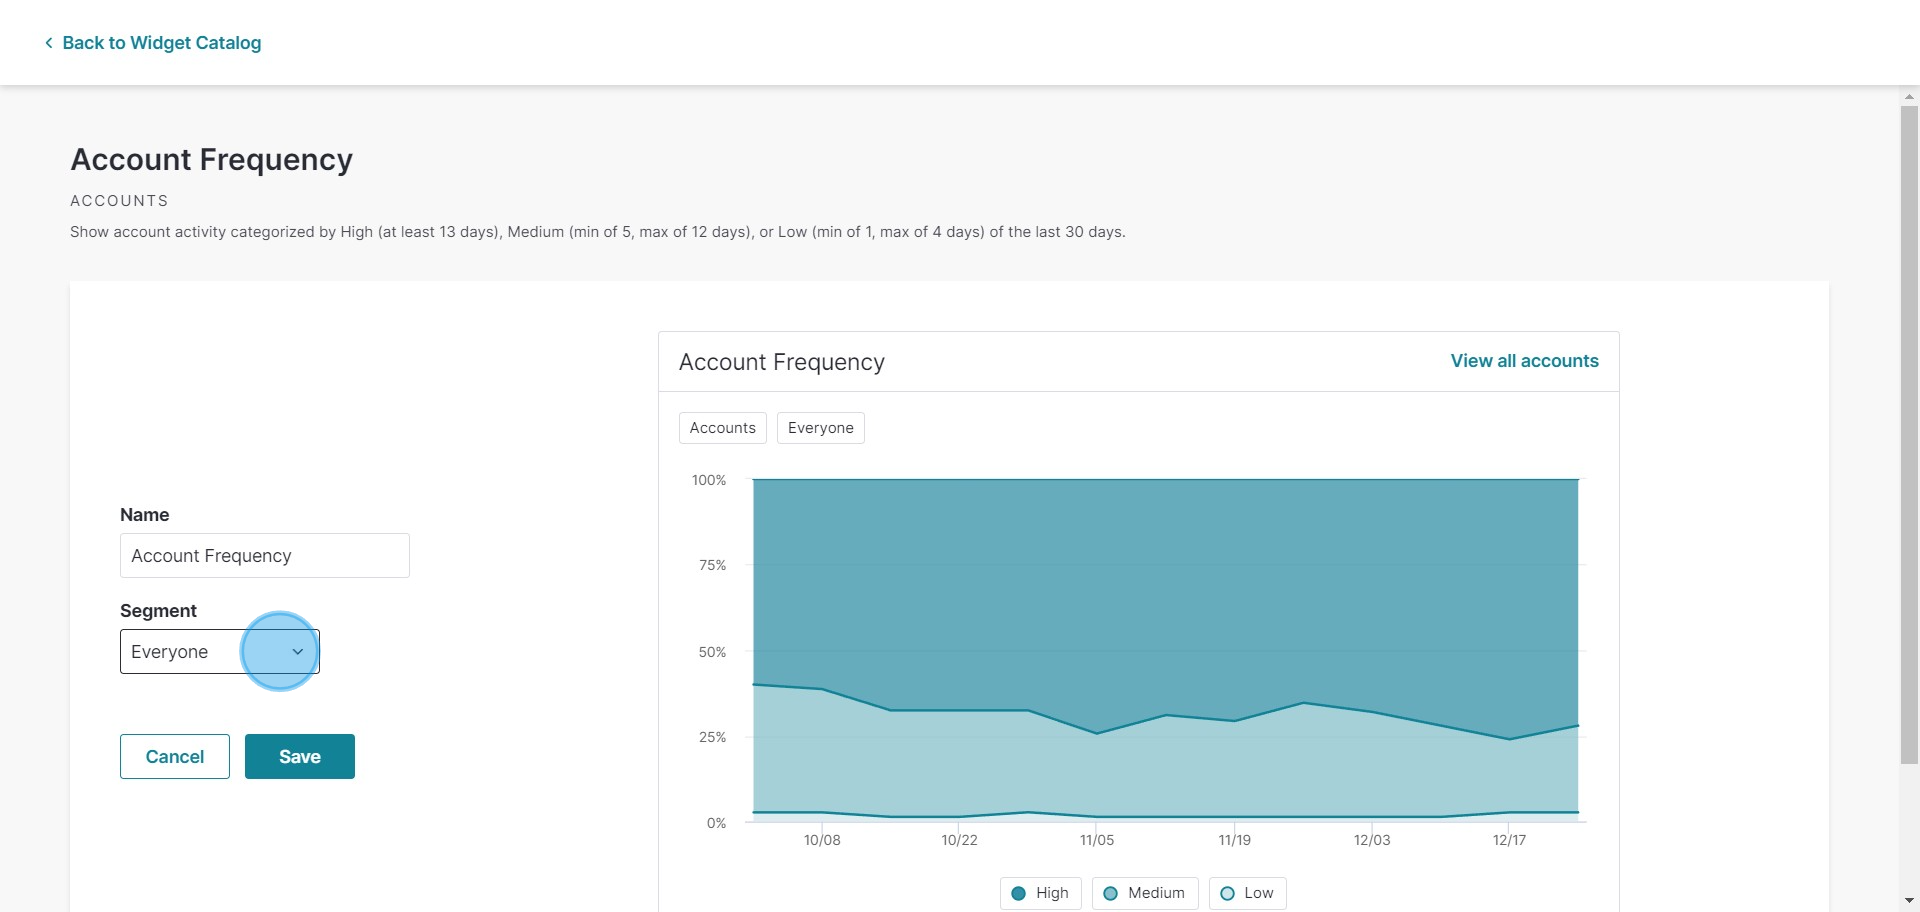
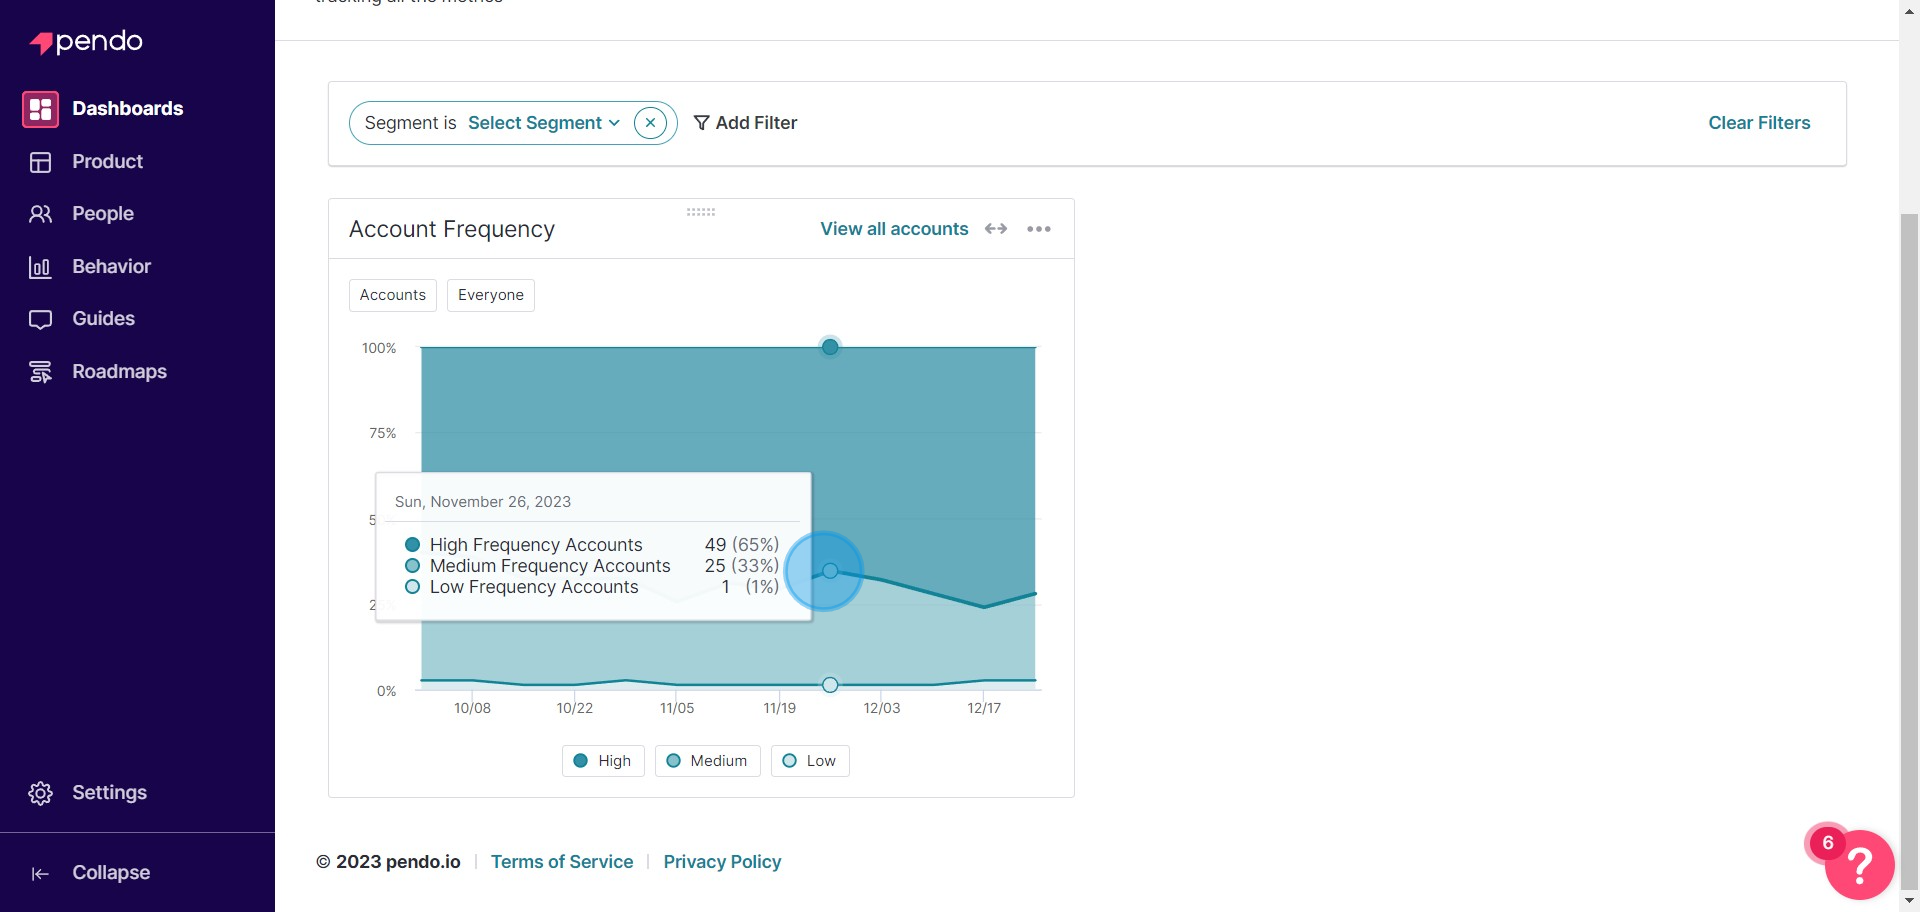
6. Use the dropdown menu to filter the data for your dashboard.
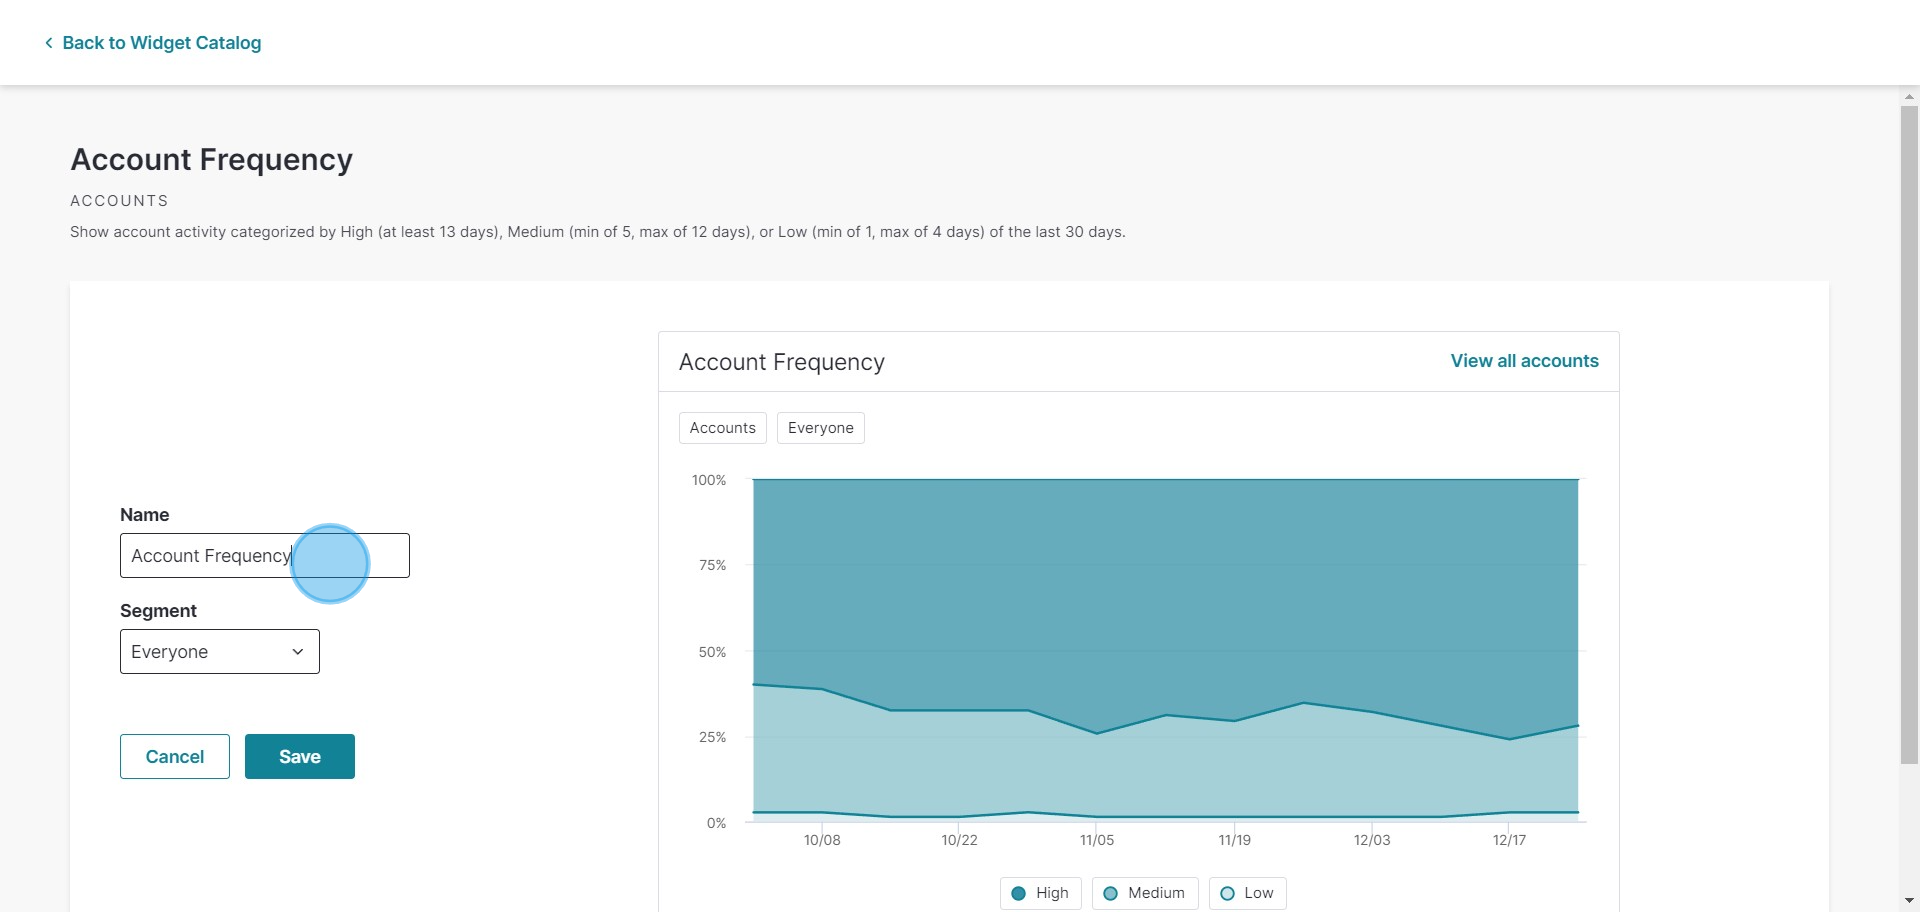
7. Rename the metrics for easy future reference.
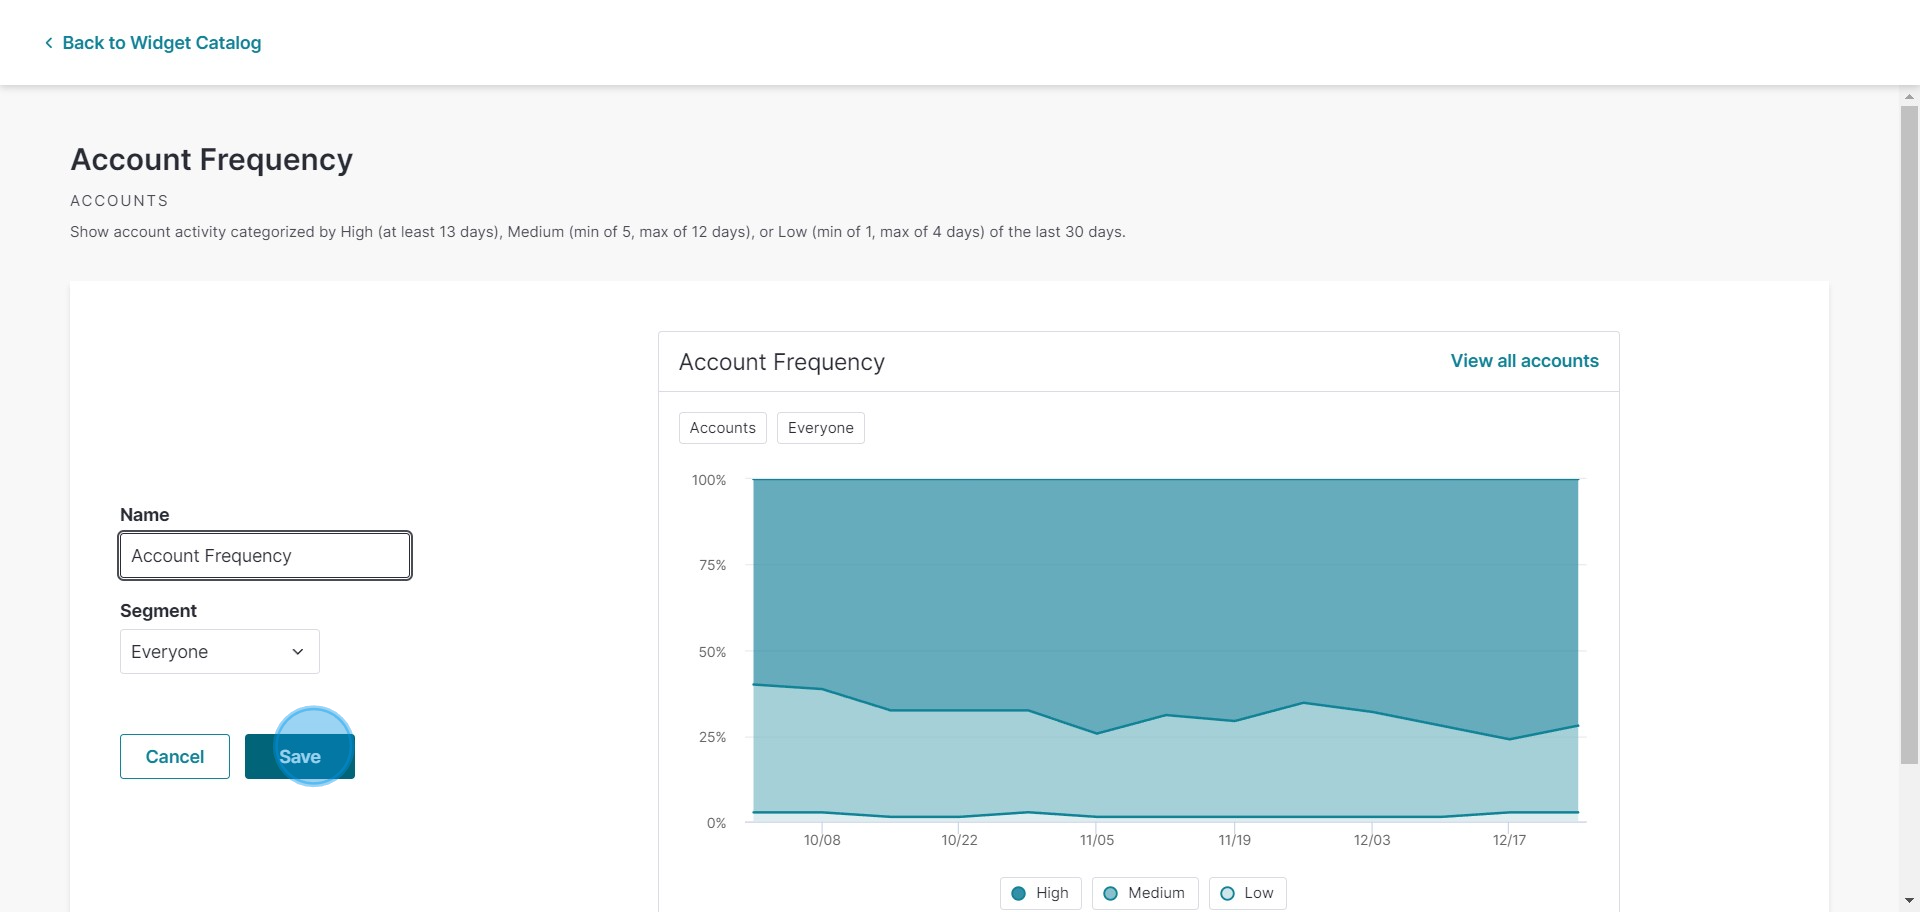
8. Save your changes by clicking on the 'Save' button.
9. Explore each data point for detailed analysis.
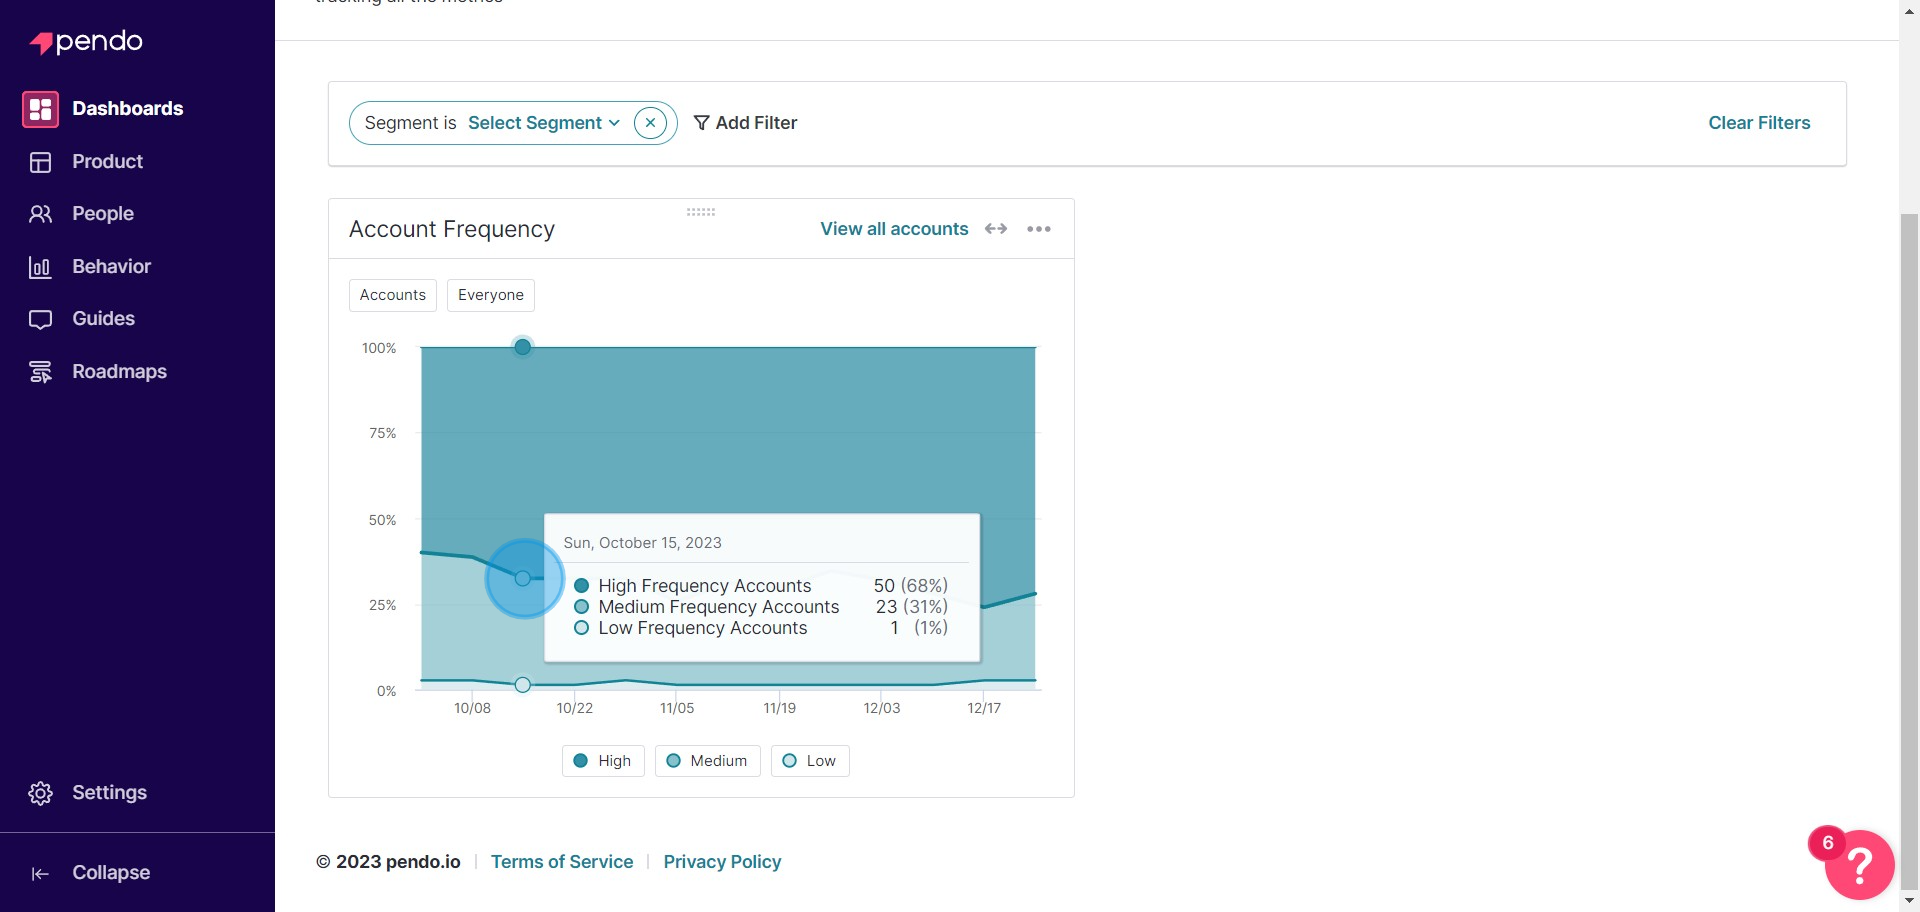
10. Congratulations! You now have a fully customized dashboard.
Create your own step-by-step demo
Scale up your training and product adoption with beautiful AI-powered interactive demos and guides. Create your first Supademo in seconds for free.