Overview
Streamline your calculations in Google Sheets with our comprehensive guide on multiplication. Learn how to optimize your workflow by efficiently multiplying values within cells, enhancing your spreadsheet skills. This step-by-step guide provides a seamless process for performing multiplication in Google Sheets, ensuring increased efficiency and clarity in your data management tasks.
Who is Google Sheets best suited for?
Google Sheets is best suited for a wide range of professionals, including Financial Analysts, Project Managers, and Data Analysts. For example, Financial Analysts can use Google Sheets for budgeting and financial forecasting, Project Managers can leverage it for tracking project milestones and resource allocation, and Data Analysts can use it for organizing and analyzing datasets, all benefiting from Google Sheets' collaborative features and powerful data processing capabilities.
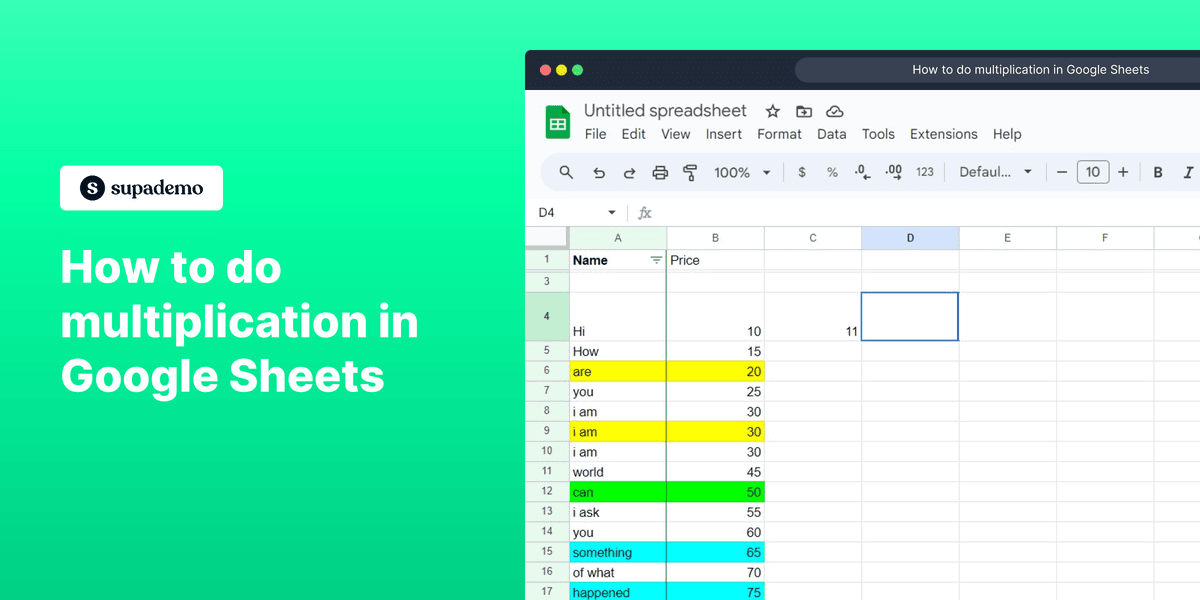
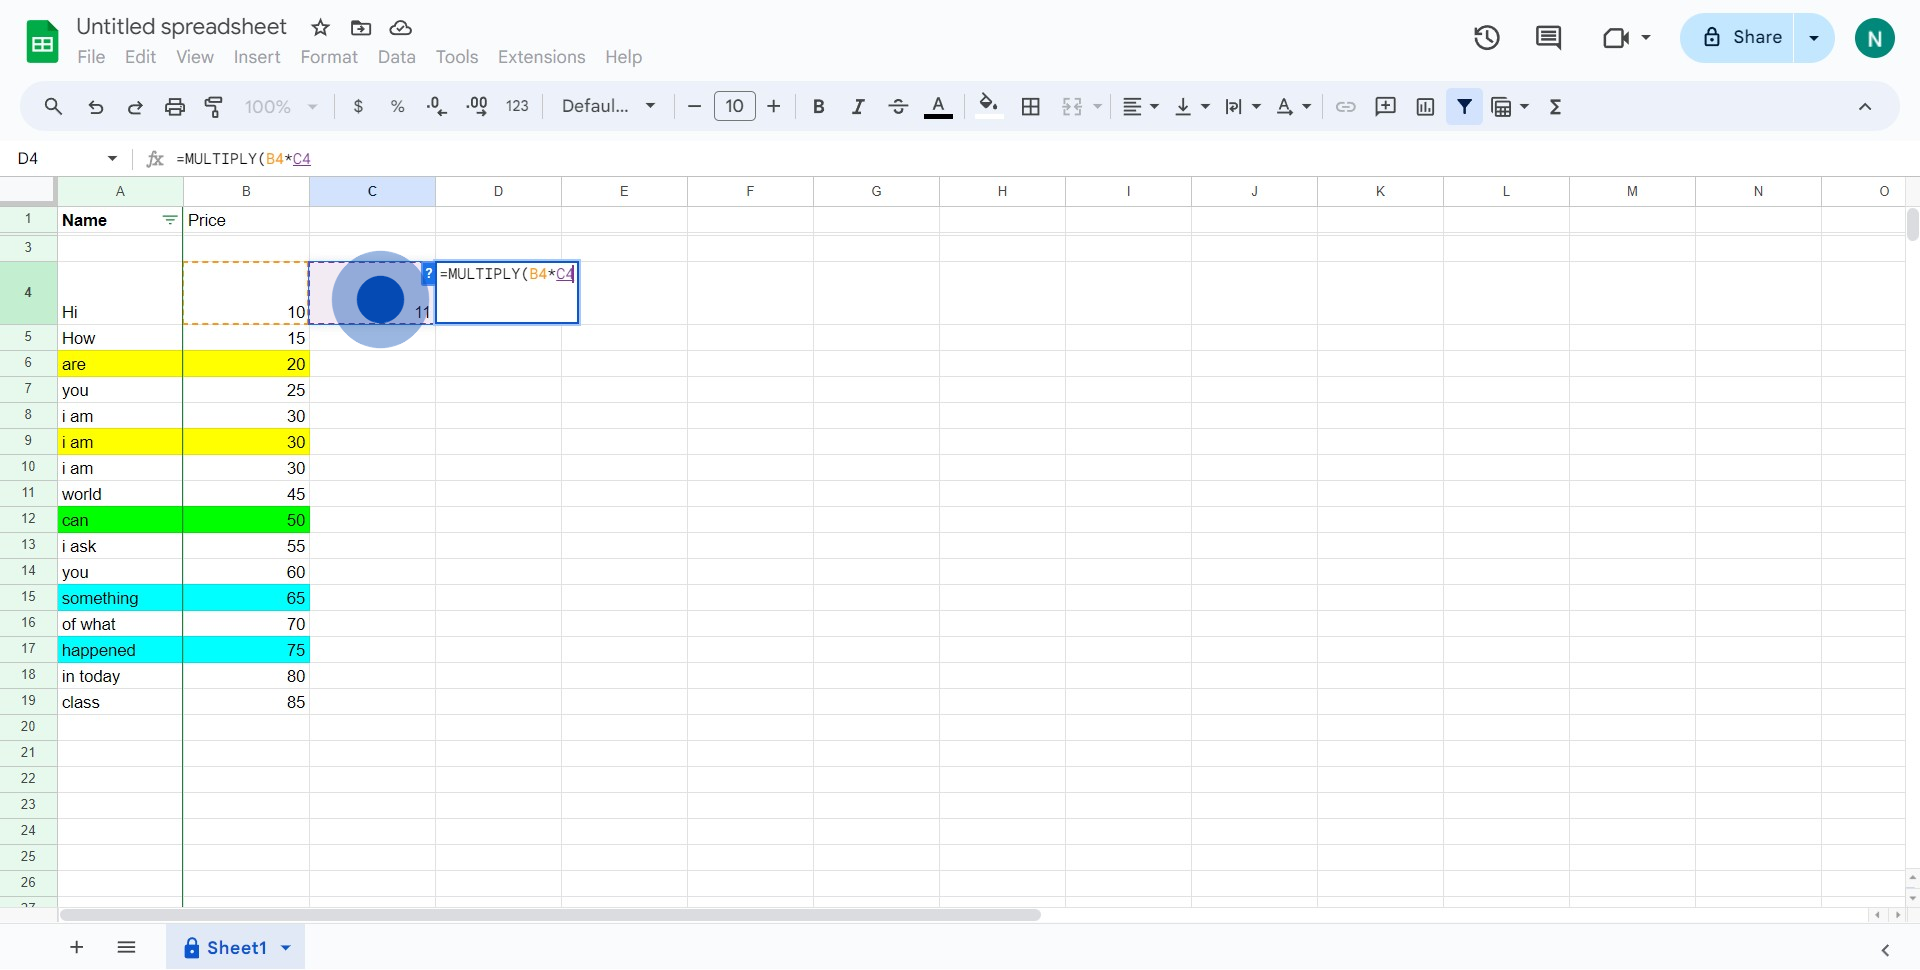
How to do multiplication in Google Sheets
1. Start by selecting the designated box.
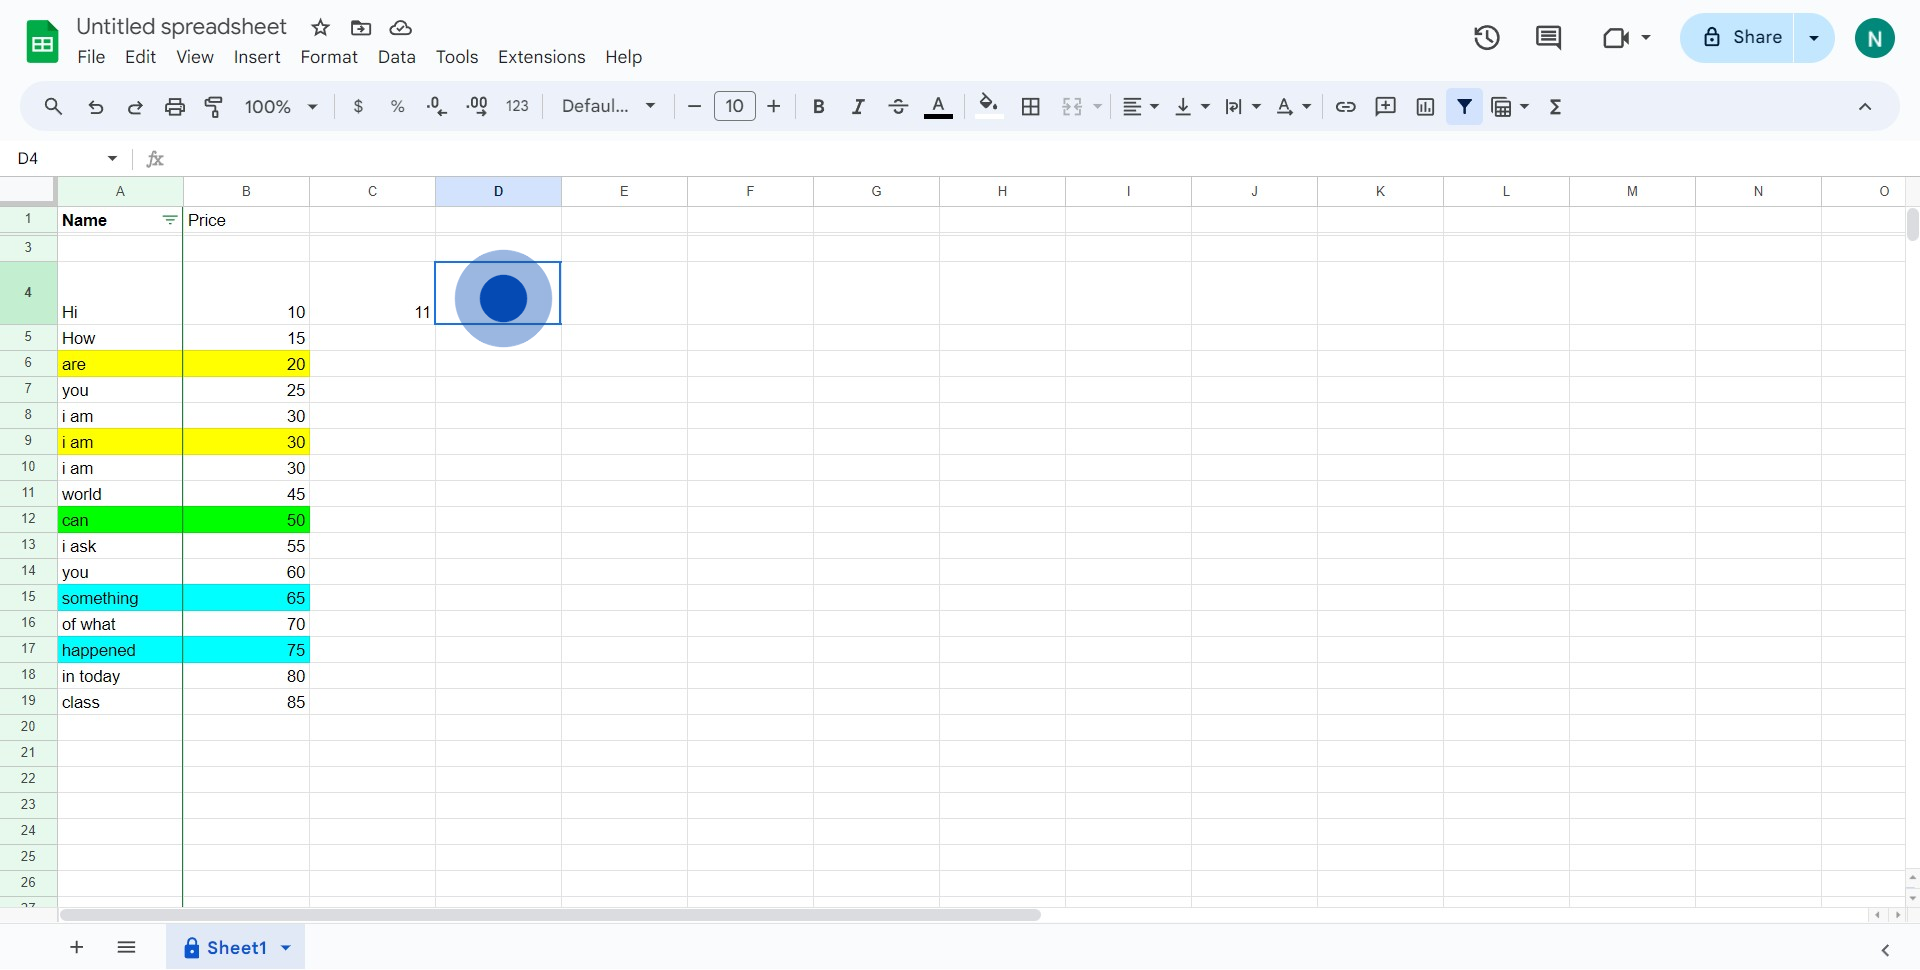
2. Next, locate and click on the 'MULTIPLY' option.

3. Then, click again to choose your preferred element.
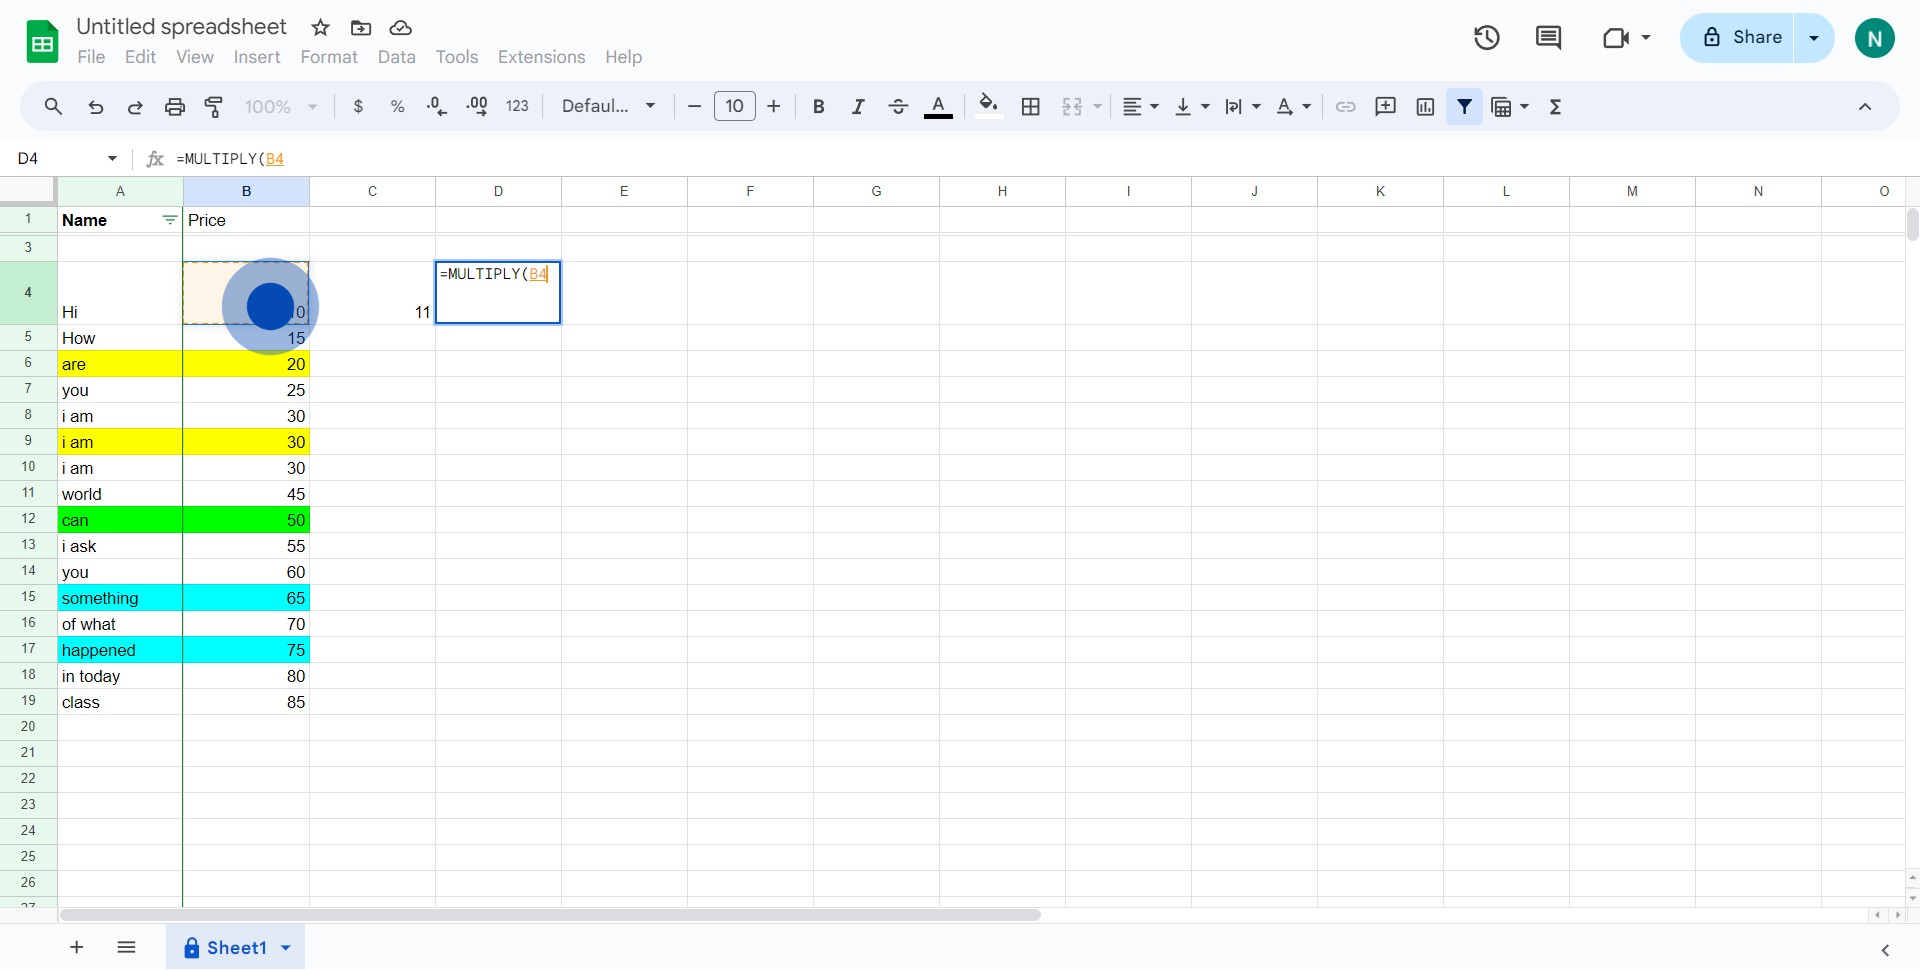
4. Finally, conclude by clicking on the selected element once more.
Common FAQs on Google Sheets
Commonly asked questions about this topic.
How do I filter data in Google Sheets?
To filter data, select the range of cells you want to apply the filter to, including headers. Click on “Data” in the top menu and choose “Create a filter.” Small filter icons will appear next to your column headers. Click on these icons to access filter options, such as sorting data, selecting specific values, or applying conditions (e.g., greater than, contains). This allows you to view and analyze specific subsets of your data based on the criteria you set.
How can I create a chart or graph in Google Sheets?
To create a chart, select the data range you want to include in the chart. Click on “Insert” in the top menu and select “Chart.” Google Sheets will automatically suggest a chart type based on your data. You can customize the chart by using the Chart Editor panel that appears on the right side. You can change the chart type, adjust chart and axis titles, modify colors, and apply various styles to better visualize your data.
How do I use formulas in Google Sheets?
To use formulas, click on the cell where you want the result to appear and type = followed by the formula. For example, to sum a range of cells, type =SUM(A1:A10) and press Enter. Google Sheets supports a wide range of functions, including mathematical operations (e.g., SUM, AVERAGE), text manipulation (e.g., CONCATENATE, LEFT), and logical operations (e.g., IF, AND). You can also use cell references in formulas to perform calculations based on data from other cells.
Create your own step-by-step demo
Scale up your training and product adoption with beautiful AI-powered interactive demos and guides. Create your first Supademo in seconds for free.
Nithil Shanmugam
Nithil is a startup-obsessed operator focused on growth, sales and marketing. He's passionate about wearing different hats across startups to deliver real value.