Overview
Efficiently manage your data in Google Sheets by utilizing color filters to organize and categorize information. Enhance user experience and simplify navigation by employing relevant color-coded filters for easy identification. This guide offers a seamless step-by-step process to apply and leverage color filters, optimizing efficiency and clarity in data management within Google Sheets.
Who is Google Sheets best suited for?
Google Sheets is best suited for a wide range of professionals, including Financial Analysts, Project Managers, and Data Analysts. For example, Financial Analysts can use Google Sheets for budgeting and financial modeling, Project Managers can leverage it for tracking project timelines and resources, and Data Analysts can use it for organizing, analyzing, and visualizing data, all benefiting from Google Sheets’ real-time collaboration and powerful data processing features.
How to filter by color in Google Sheets
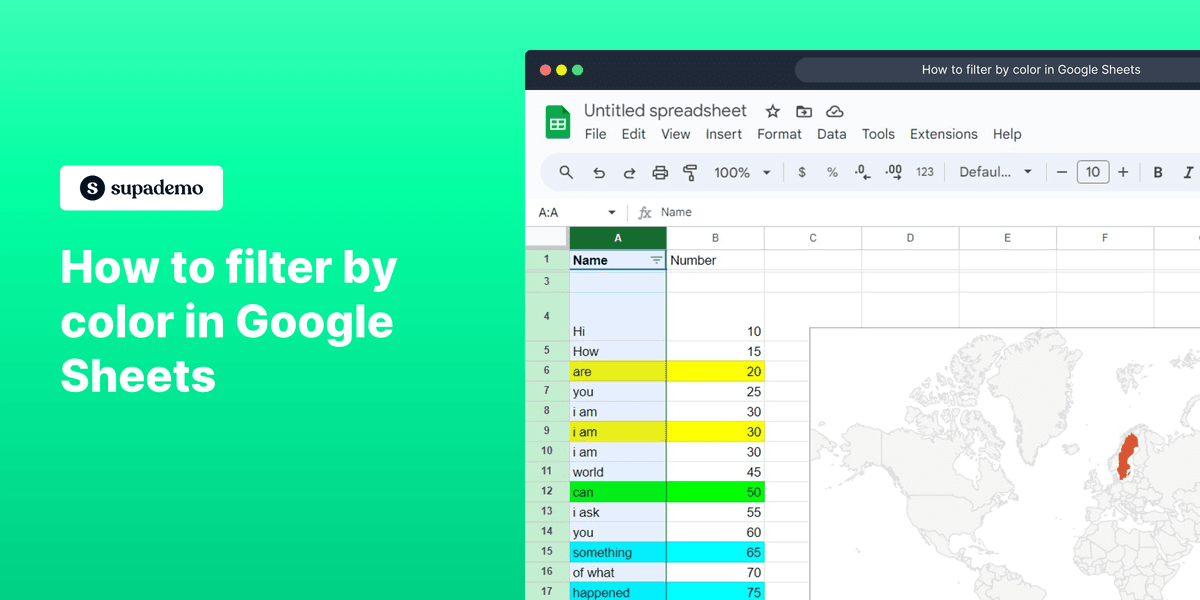
1. Let's start by selecting the desired column.
2. Next, access the filter view option by clicking it.
3. Now, let's select the 'Filter by color' option from the list.
4. Moving further, choose the 'Fill Color' option.
5. Finally, pick 'yellow' to get your filtered results.
Common FAQs on Google Sheets
Commonly asked questions about this topic.
How do I create and format a spreadsheet in Google Sheets?
How can I collaborate with others on a Google Sheets document?
How do I use functions and formulas in Google Sheets?
Create your own step-by-step demo
Content Marketer
Nithil is a startup-obsessed operator focused on growth, sales and marketing. He's passionate about wearing different hats across startups to deliver real value.