Overview
Streamline your Google Sheets experience by mastering the art of inserting shapes seamlessly. Enhance your document's visual appeal and organization by effortlessly incorporating shapes to highlight key elements. This comprehensive guide takes you through a user-friendly process, providing step-by-step instructions on how to insert and customize shapes within Google Sheets. Elevate your data presentation, optimize visual communication, and boost productivity with this efficient guide on leveraging shapes in the Google Sheets environment.
Who is Google Sheets best suited for?
Google Sheets is best suited for a wide range of professionals, including Financial Analysts, Operations Managers, and Event Planners. For example, Financial Analysts can use Google Sheets for budgeting and financial forecasting, Operations Managers can leverage it for tracking workflows and resource allocation, and Event Planners can use it for managing schedules and coordinating logistics, all benefiting from Google Sheets’ real-time collaboration and data management features.
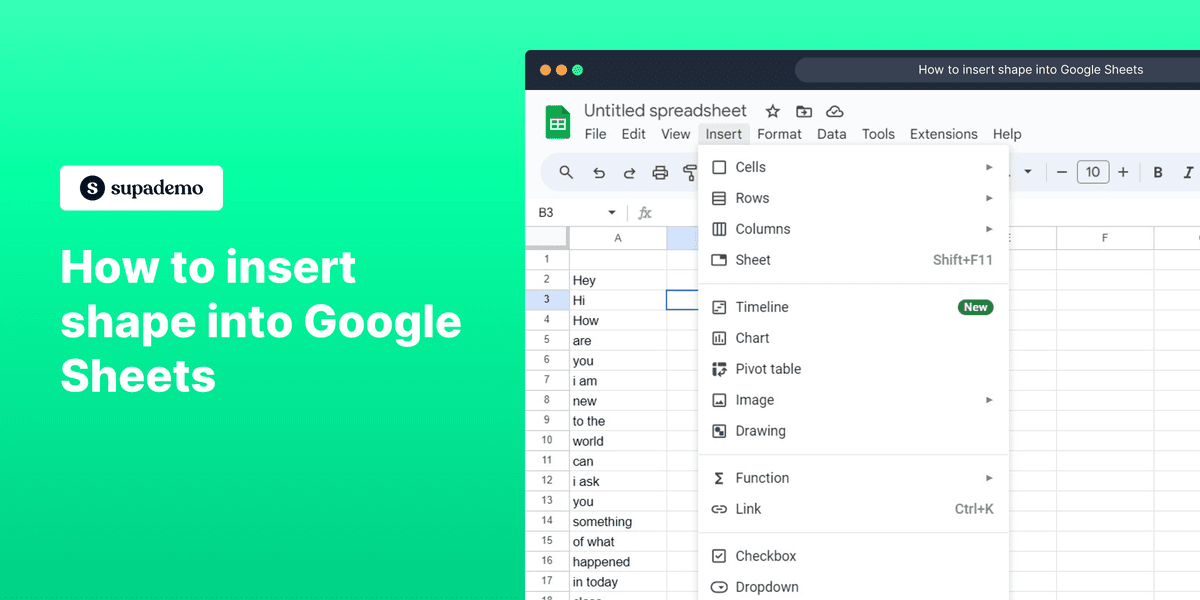
How to insert shape into Google Sheets
1. Start by selecting the 'Insert' option.
2. Next, choose the 'Drawing' option from the dropdown.
3. Click on the available icon to proceed.
4. Select the 'Rectangle' option as your desired shape.
5. Then, click to place the element in your sheet.
6. Once done, click on 'Save and Close' to insert the shape.
7. Voila! Your shape is now inserted.
Common FAQs on Google Sheets
Commonly asked questions about this topic.
How can I use formulas in Google Sheets?
How do I create charts in Google Sheets?
How can I protect a sheet or range in Google Sheets?
Create your own step-by-step demo
Nithil Shanmugam
Nithil is a startup-obsessed operator focused on growth, sales and marketing. He's passionate about wearing different hats across startups to deliver real value.