Overview
Simplify your Google Sheets experience with a guide on reverting to earlier versions effortlessly. Enhance workflow efficiency by understanding the seamless process of rolling back changes, ensuring clarity and precision in your data management within the Google Sheets platform. Streamline your tasks with this comprehensive guide, empowering you to navigate through version history for optimal control and data accuracy.
Who is Google Sheets best suited for?
Google Sheets is best suited for a wide range of professionals, including Financial Analysts, Project Managers, and Data Scientists. For example, Financial Analysts can use Google Sheets for creating budgets and financial reports, Project Managers can leverage it for tracking project milestones and tasks, and Data Scientists can use it for organizing and analyzing large datasets, all benefiting from Google Sheets’ collaborative features and powerful data processing capabilities.
How to revert to an earlier version in Google Sheets
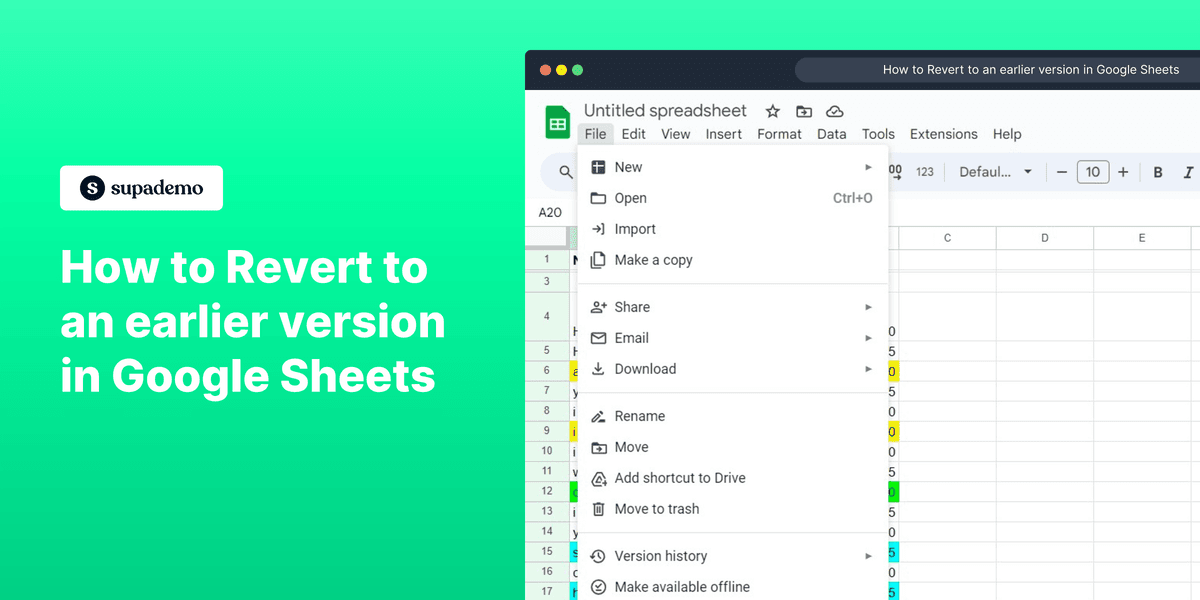
1. Start by selecting the 'File' menu.
2. Then, choose the 'Version history' option from the dropdown.
3. Click on the 'See version history' option next.
4. Find the option you want and click on it.
5. Proceed by choosing the 'Restore this version' command.
6. Confirm your action by selecting 'Restore'.
7. Congratulations, you have successfully restored to an earlier version of the document.
Common FAQs on Google Sheets
Commonly asked questions about this topic.
How do I use pivot tables in Google Sheets?
How can I create a chart or graph in Google Sheets?
How do I use the IMPORTRANGE function to import data from another Google Sheet?
Create your own step-by-step demo
Nithil Shanmugam
Nithil is a startup-obsessed operator focused on growth, sales and marketing. He's passionate about wearing different hats across startups to deliver real value.