
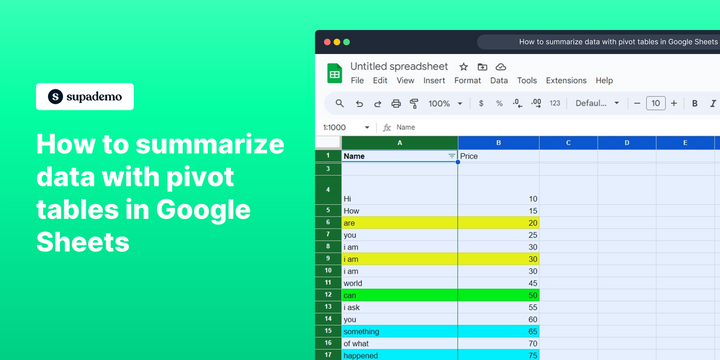
Overview
Streamline your data analysis in Google Sheets with our comprehensive guide on summarizing data using pivot tables. Optimize your workflow by organizing and categorizing information effortlessly. Improve clarity and efficiency in data management within the Google Sheets platform with step-by-step instructions, ensuring you can make the most out of pivot tables for insightful and streamlined data summaries.
Who is Google Sheets best suited for?
Google Sheets is best suited for a wide range of professionals, including Financial Analysts, Project Managers, and Data Analysts. For example, Financial Analysts can use Google Sheets for budgeting and financial analysis, Project Managers can leverage it for tracking project timelines and resources, and Data Analysts can use it for organizing and visualizing data, all benefiting from Google Sheets’ real-time collaboration and powerful data processing features.
How to summarize data with pivot tables in Google Sheets
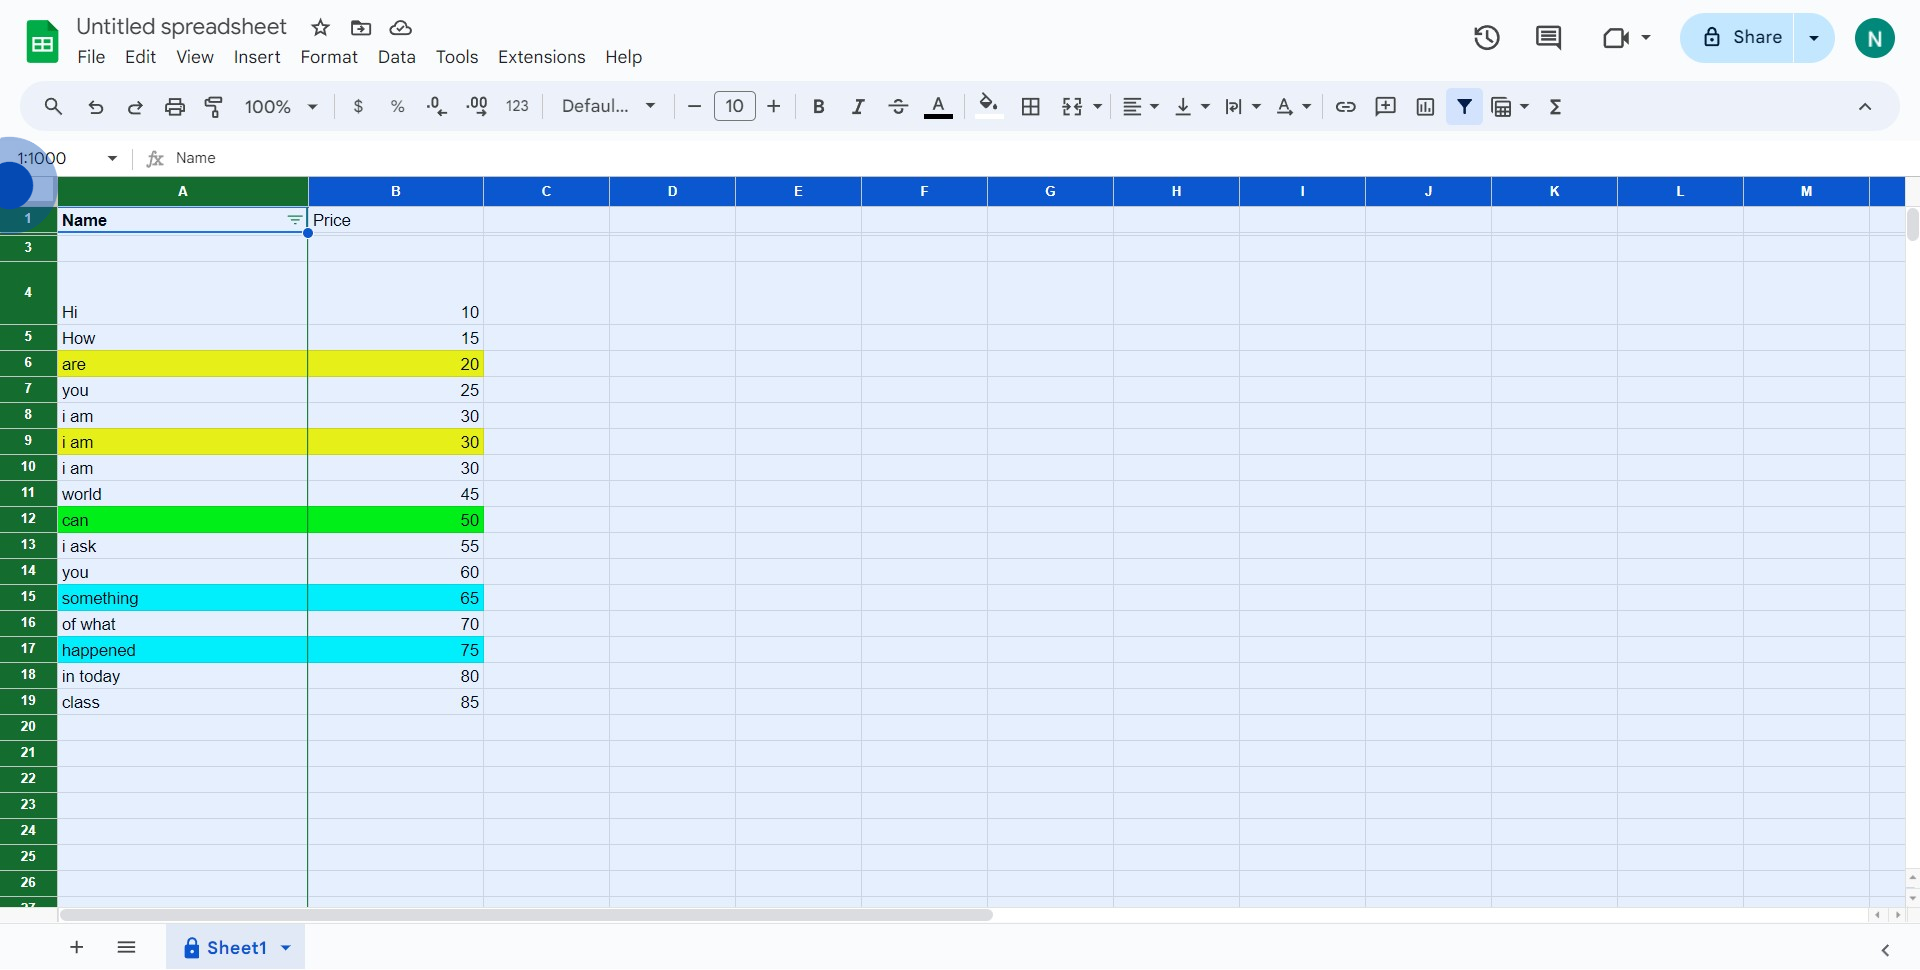
1. Begin by selecting the entire data sheet for evaluation.
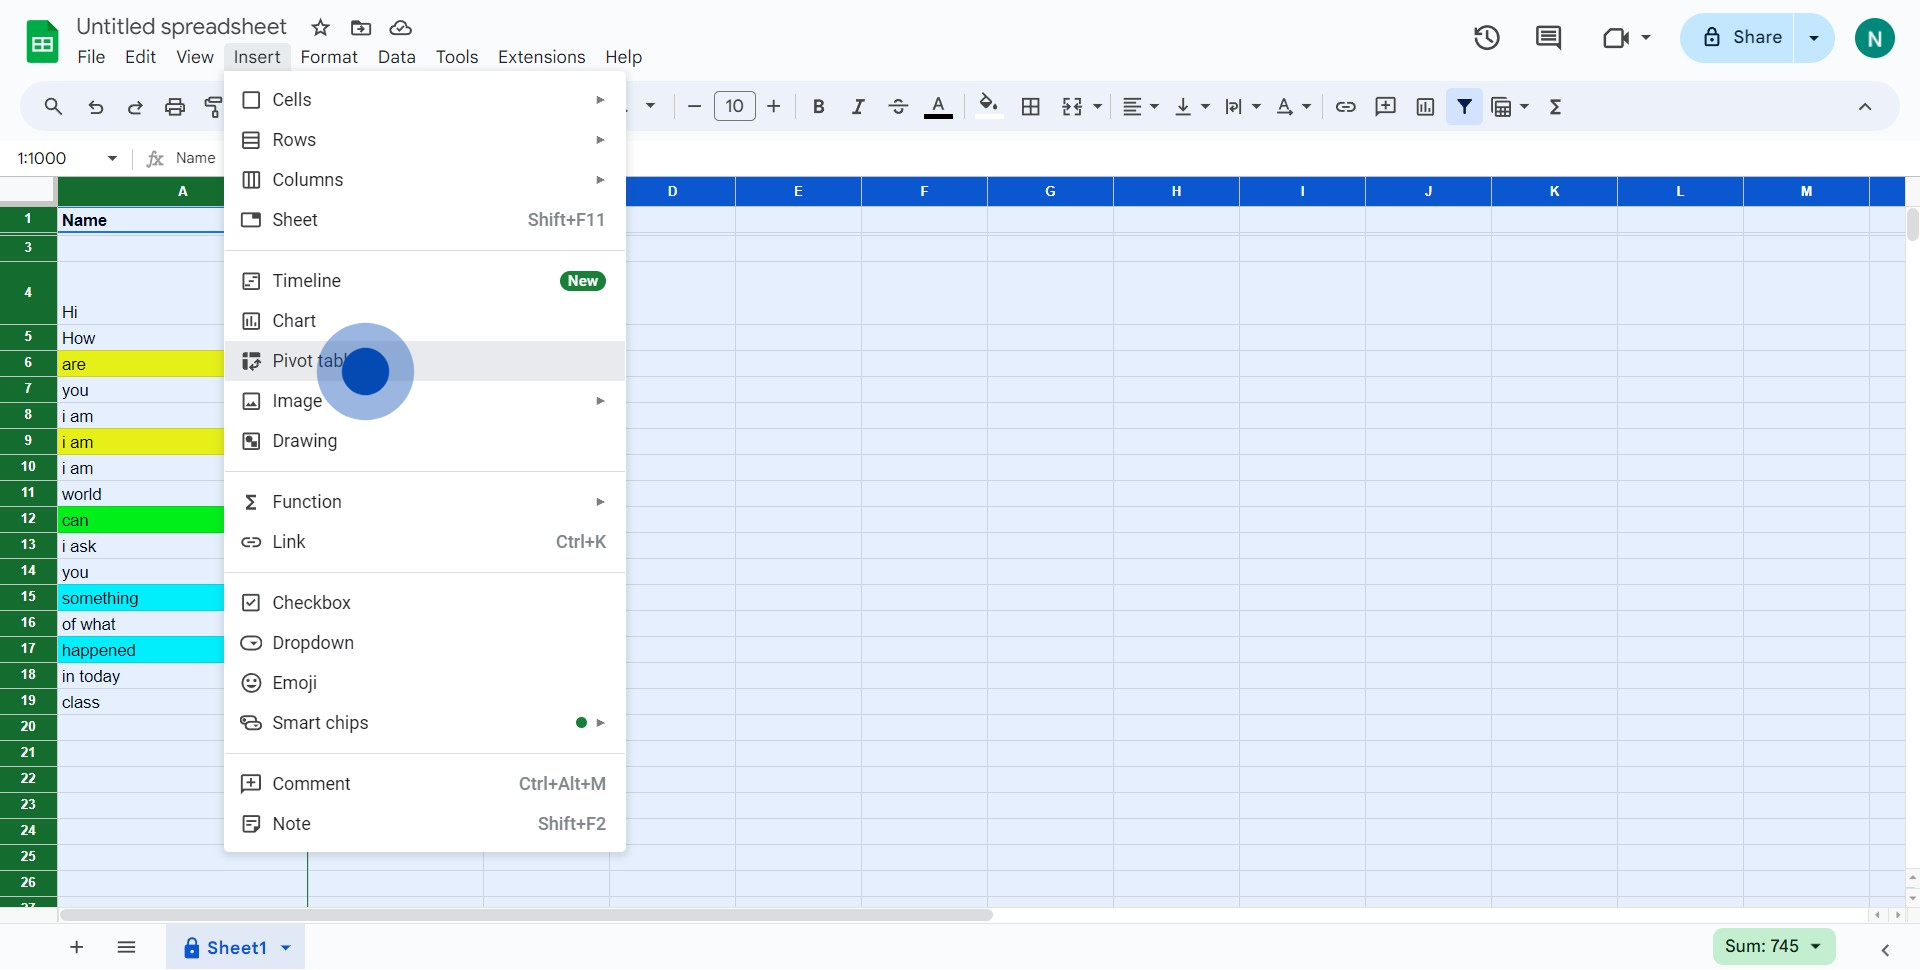
2. Next, navigate to the 'Insert' function in your menu.
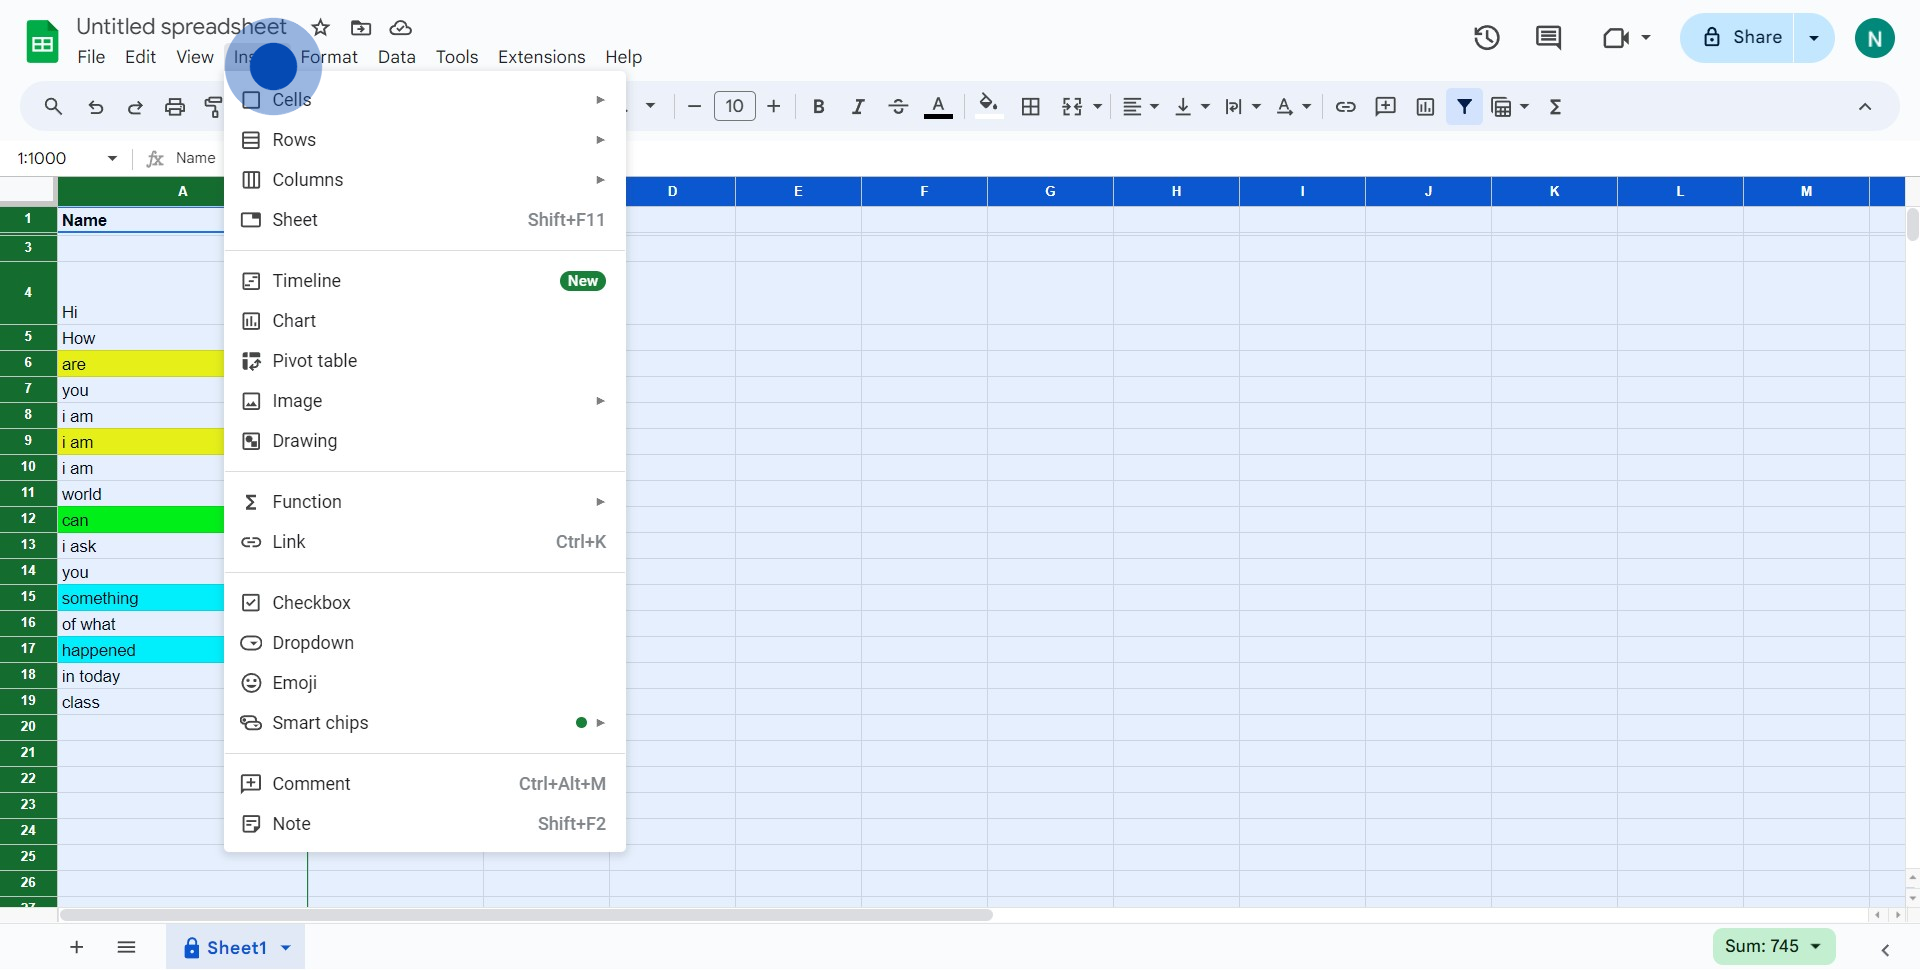
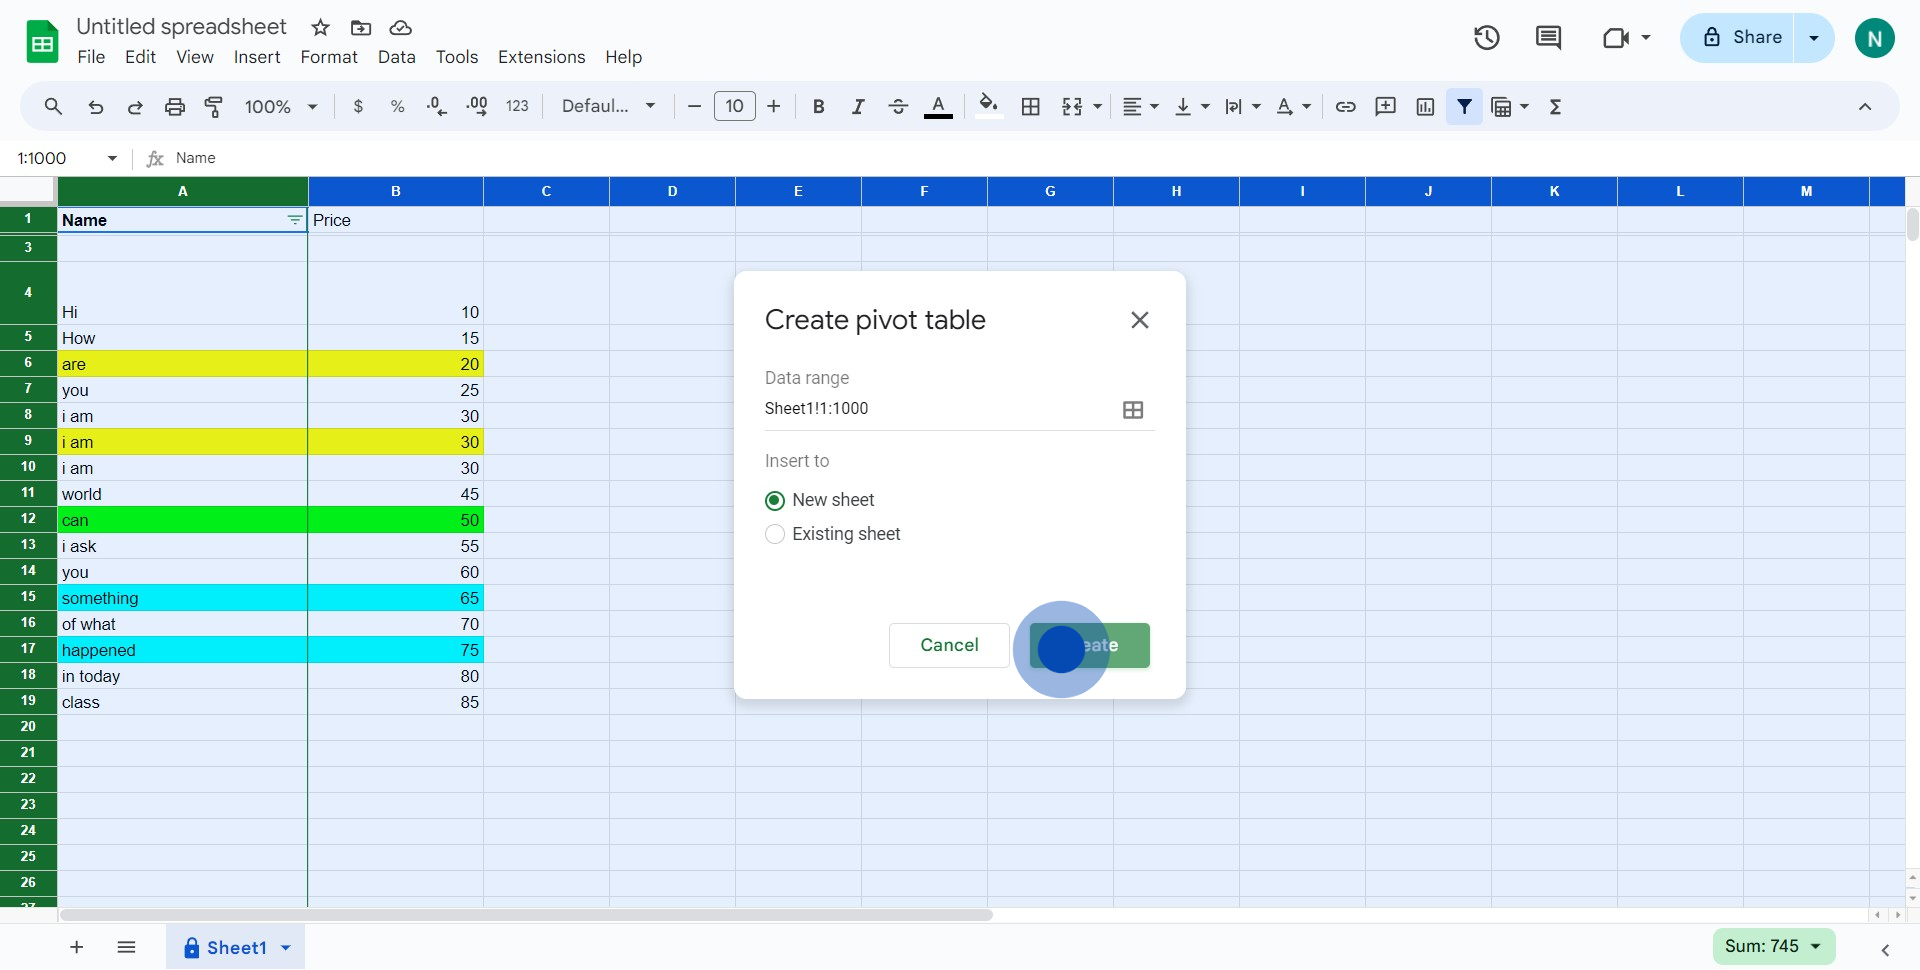
3. Now, find and select the 'Pivot Table' option among your tools.
4. Finally, click 'Create' to initialize your Pivot Table and view your summarized data.
Common FAQs on Google Sheets
How do I use formulas and functions in Google Sheets?
To use formulas and functions in Google Sheets, click on the cell where you want the result to appear and type an equals sign (=) followed by the function name or formula. For example, to sum a range of cells, you would type =SUM(A1:A10) and press Enter. Google Sheets offers a wide range of functions, including mathematical functions (SUM, AVERAGE), logical functions (IF, AND), and lookup functions (VLOOKUP, HLOOKUP). As you type, Google Sheets will often suggest functions and provide syntax help to guide you.
How can I collaborate with others on a Google Sheets document?
To collaborate on a Google Sheets document, open the sheet you want to share and click the “Share” button in the top-right corner. Enter the email addresses of the people you want to collaborate with and set their permission levels (e.g., Viewer, Commenter, Editor). You can also generate a shareable link with specific access levels. Collaborators can then view or edit the document in real-time, and you can track changes and comments made by others. Google Sheets supports simultaneous editing and commenting, making it easy for teams to work together on the same document.
How do I create and use data validation rules in Google Sheets?
To create data validation rules, select the cell or range of cells where you want to apply the validation, then go to “Data” in the top menu and choose “Data validation.” In the data validation dialog, you can set criteria for the data that can be entered, such as specific values, ranges, or text patterns. You can also create drop-down lists for easy data entry or set custom error messages to guide users. Once configured, click “Save” to apply the validation rules. Data validation helps ensure that data entered into your sheet meets specific requirements and maintains data integrity.
Create your own step-by-step demo
Scale up your training and product adoption with beautiful AI-powered interactive demos and guides. Create your first Supademo in seconds for free.