
In the fast-paced world of Software-as-a-Service (SaaS), understanding user challenges and addressing them is crucial for sustained success. However, for SaaS companies operating with minimal user interactions, gauging user needs becomes a challenge. This is where product-led growth metrics come into play, enabling companies to track progress, identify areas for improvement, and supercharge their growth over time. In this comprehensive guide, we will explore the best product-led growth metrics that every SaaS company should track to become a rising star in the industry.
The Significance of Product-Led Growth Metrics
Understanding Product-Led Growth Metrics:
When implementing a product-led growth (PLG) strategy, tracking relevant metrics is essential. These metrics help measure the impact and success of your PLG strategy, providing insights into progress, areas for improvement, and the overall growth of your SaaS company. By leveraging these metrics, you can align your efforts to drive user engagement, enhance customer satisfaction, improve net revenue retention, and achieve sustainable growth.
The Value of Measuring the Right Product-Led Growth Metrics:
Measuring the right product-led growth metrics ensures that your PLG strategy stays on track. These metrics offer valuable insights across various aspects of growth, including user engagement, customer satisfaction, net revenue retention, and more. By tracking these metrics, you can monitor your progress against growth targets, optimize your PLG strategy, and make data-driven decisions to enhance your product's performance.
Ownership of Product-Led Growth Metrics
Shared Responsibility across Functions
Effective PLG strategies require collaboration across different teams within your organization. Sales, marketing, customer success, product, and engineering teams each play a crucial role in shaping and executing your PLG strategy. Product marketers generate leads, growth marketers drive revenue, product managers ensure user engagement, and sales reps respond to customer requests. As such, each department shares ownership of the product-led growth metrics, collectively driving the success of your organization's PLG strategy.
Key Product-Led Growth Metrics to Track in 2023
Product Stickiness:
Product stickiness measures the extent to which users find value in your product and continue to use it regularly. By quantifying product stickiness, you can visualize the value your product offers, identify factors that drive user retention, and understand variations in product usage among different user personas. For example, users who discover the value of features like sentence rephrasing and idea expansion in a demo software like Wordtune are more likely to become frequent users.
Churn Rate:
Churn rate measures the percentage of users who discontinue using your product, resulting in revenue loss. By tracking churn rate, you can identify points of drop-off in the user journey, collect feedback to address user concerns, and tailor your product to meet the needs of different user personas. Understanding why users switch from a product like Calendly to 3veta for appointment scheduling helps optimize the user experience and minimize churn.
Time to Value (TTV)
Time to value (TTV) focuses on how quickly users can derive value from your product and reach their "aha" moment. By calculating TTV, you can identify potential friction points in the user onboarding journey, enhance the onboarding experience, and provide proactive support to guide new users. Incorporating an interactive demo within your website expedites users' journey to their "aha" moments, reducing TTV.
Product Adoption Rate:
Product adoption rate measures the percentage of users who integrate your product into their workflows and become regular users, showing loyalty and resistance to switching to competitors.
By tracking adoption rate, you can identify the features and functionalities that resonate most with users, refine your product roadmap, and prioritize development efforts to encourage widespread adoption. Analyzing user behavior after releasing a mobile app version of your product allows you to assess adoption rates and optimize the app's user experience.
Net Promoter Score (NPS):
Net Promoter Score (NPS) quantifies customer loyalty and satisfaction by asking users a simple question: "How likely are you to recommend our product to a friend or colleague?" By calculating NPS, you can gauge overall customer sentiment, identify promoters who advocate for your product, and uncover areas for improvement to enhance customer satisfaction. Utilizing automated NPS surveys through email campaigns helps gather valuable feedback to fuel your product-led growth strategy.
Monthly Recurring Revenue (MRR):
Monthly Recurring Revenue (MRR) is a key financial metric that measures the predictable and recurring revenue generated by your SaaS product on a monthly basis. By tracking MRR, you can assess revenue growth, evaluate the effectiveness of your pricing strategy, and identify opportunities to upsell or cross-sell to existing customers. Implementing dynamic pricing tiers or offering add-on features can drive MRR growth for your product.
Revenue Expansion Rate:
Revenue Expansion Rate measures the rate at which existing customers increase their spending on your product over time. By monitoring revenue expansion, you can identify upsell and cross-sell opportunities, nurture customer relationships, and optimize your pricing and packaging strategies. Regularly analyzing customer usage patterns and offering tailored upgrade options can boost revenue expansion.
Active Users:
Active Users metric tracks the number of users who are actively engaging with your product within a specific time period. This metric helps you understand the level of user engagement, identify user segments with high or low activity, and design targeted engagement campaigns. Monitoring active users enables you to assess the impact of feature releases or updates and drive continued product usage.
Feature Engagement:
Feature Engagement metric measures how frequently and extensively users are utilizing specific features within your product. By analyzing feature engagement, you can identify popular and underutilized features, prioritize feature enhancements, and tailor your marketing and onboarding efforts to highlight the most valuable functionalities. Understanding which features are most frequently used within a design tool like Figma can drive feature-focused marketing campaigns and user education initiatives.
Customer Health Score:
Customer Health Score assesses the overall health and satisfaction of your customers based on various factors such as usage, support tickets, and feedback. By calculating customer health scores, you can identify at-risk customers, proactively address their concerns, and drive customer success initiatives to improve retention and satisfaction. Leveraging customer health scores can help you prioritize resources and focus on customer segments that require attention.
Time on Platform:
Time on Platform metric measures the average amount of time users spend on your platform, indicating their level of engagement and the value they derive from your product. By tracking time on platform, you can evaluate user satisfaction, identify opportunities to increase engagement, and optimize the user experience. Incorporating user activity tracking and conducting user surveys can provide insights into how users spend their time on your platform.
Activation Rate:
Activation Rate calculates the percentage of users who complete the necessary onboarding steps to start using your product effectively. By tracking activation rate, you can assess the effectiveness of your onboarding process, identify bottlenecks, and optimize the user experience to drive successful activation. Implementing interactive tutorials or onboarding videos can enhance the activation rate by guiding users through initial setup and feature exploration.
Conversion Rate:
Conversion Rate evaluates the percentage of leads or trial users who convert into paying customers. By tracking conversion rate, you can assess the effectiveness of your acquisition and onboarding strategies, identify conversion barriers, and optimize your sales and marketing efforts to drive higher conversion rates. Analyzing user behavior and conducting A/B testing on landing pages and pricing options can optimize the conversion rate.
How to Measure Product Led Growth Metrics with Demo Software
So now you know the product led growth metrics you need to track. But how will you track them?
Well, you need tools to get the job done!
Here’s a list of tools, that measure product led growth metrics:
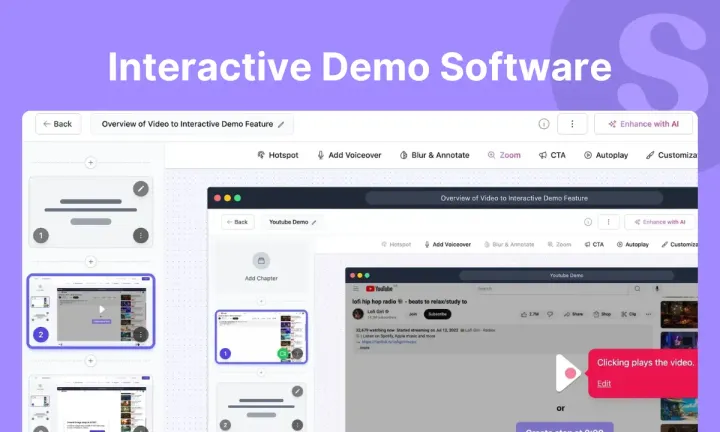
Supademo
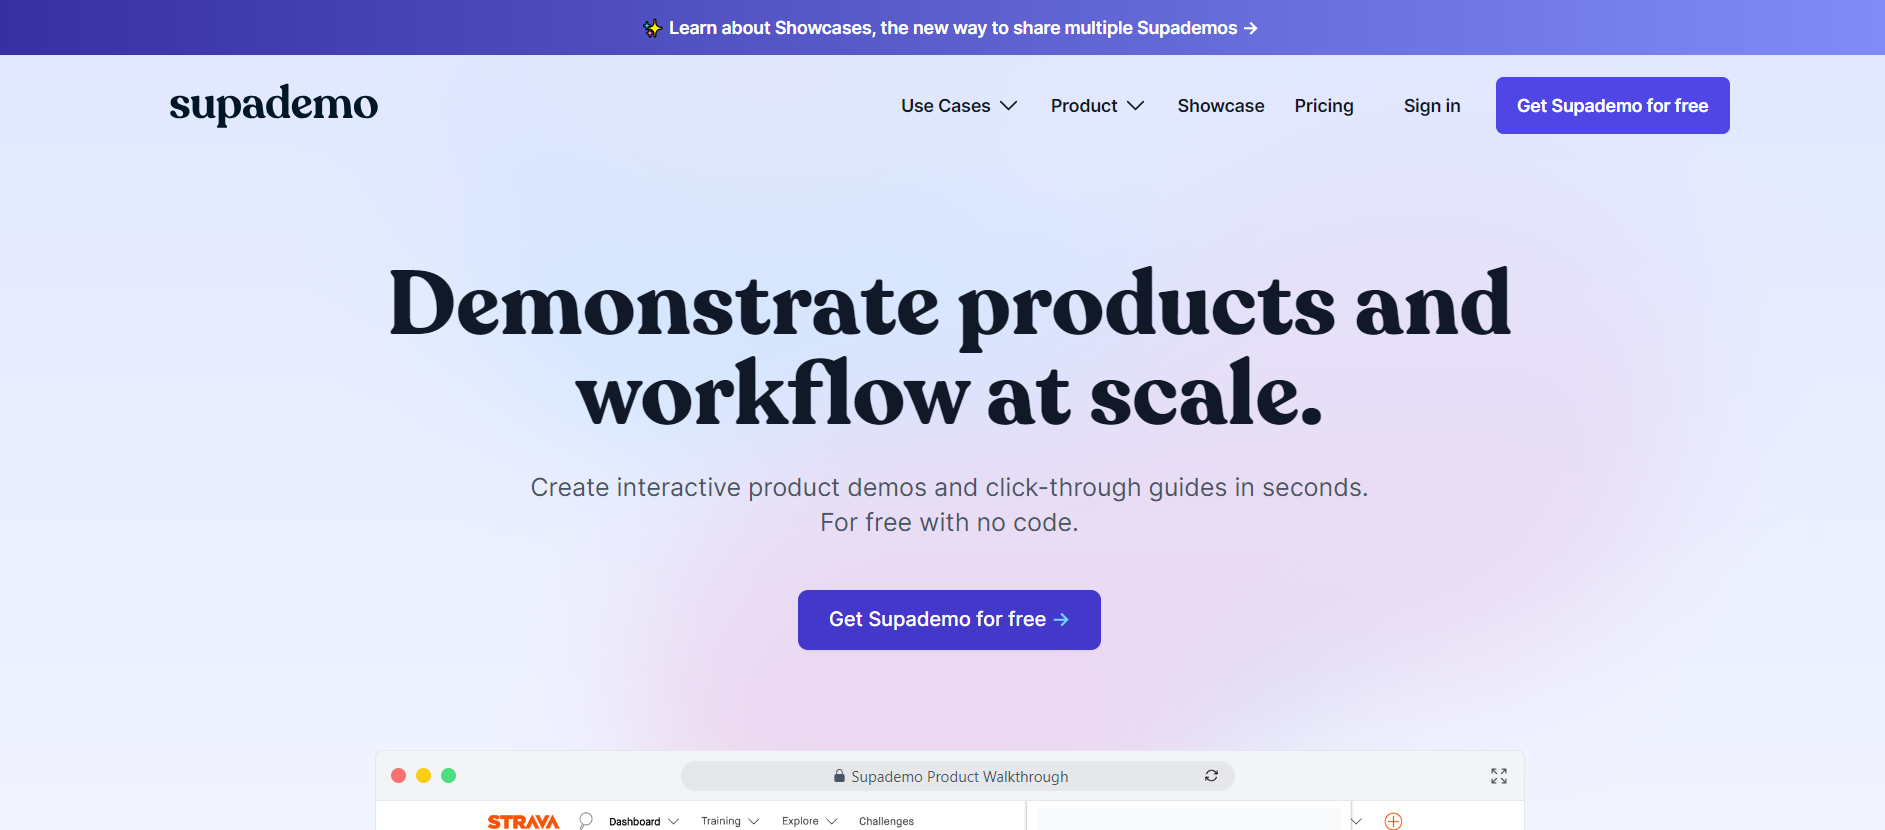
Supademo is an AI-driven platform for creating and sharing interactive demos at scale - creating a new standard for demonstrating products and workflows. It is the fastest and most user-friendly way to create click-through demos and guides with no code, for free. With Supademo, you can easily measure and analyze user behavior in your demos, gaining valuable insights to improve your product-led growth strategy.
Mixpanel

Mixpanel captures how users interact with your product. It lets you analyze product data with interactive reports and visualize it. It provides you with enough data to track and analyze user behavior on websites and identify key areas of improvement. Mixpanel offers three tools: segmentation, engagement, and retention analysis, which provide in-depth insights into user behavior.
Baremetrics
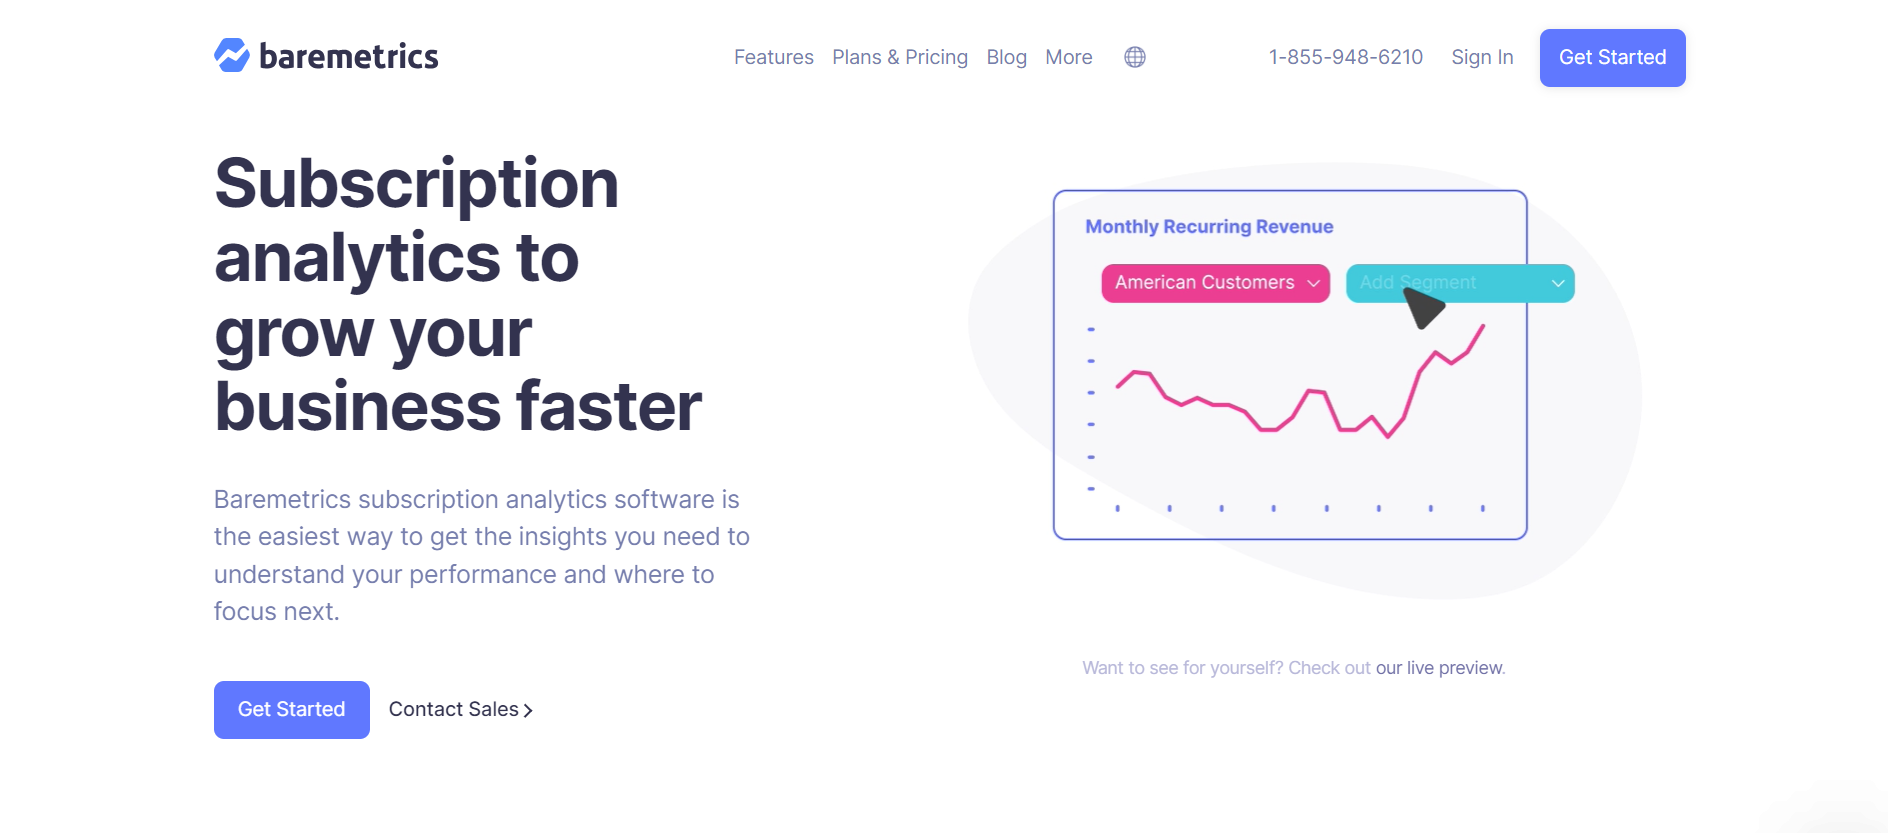
Whether you want to track signups, churned users, and metrics like LTV, ARR, or ASP, Baremetrics pulls all your revenue data into one easy-to-view dashboard. It offers plenty of features like forecasting, trial insights, cancellation insights, and augmentation that help you improve and drive more growth for your business.
Storylane
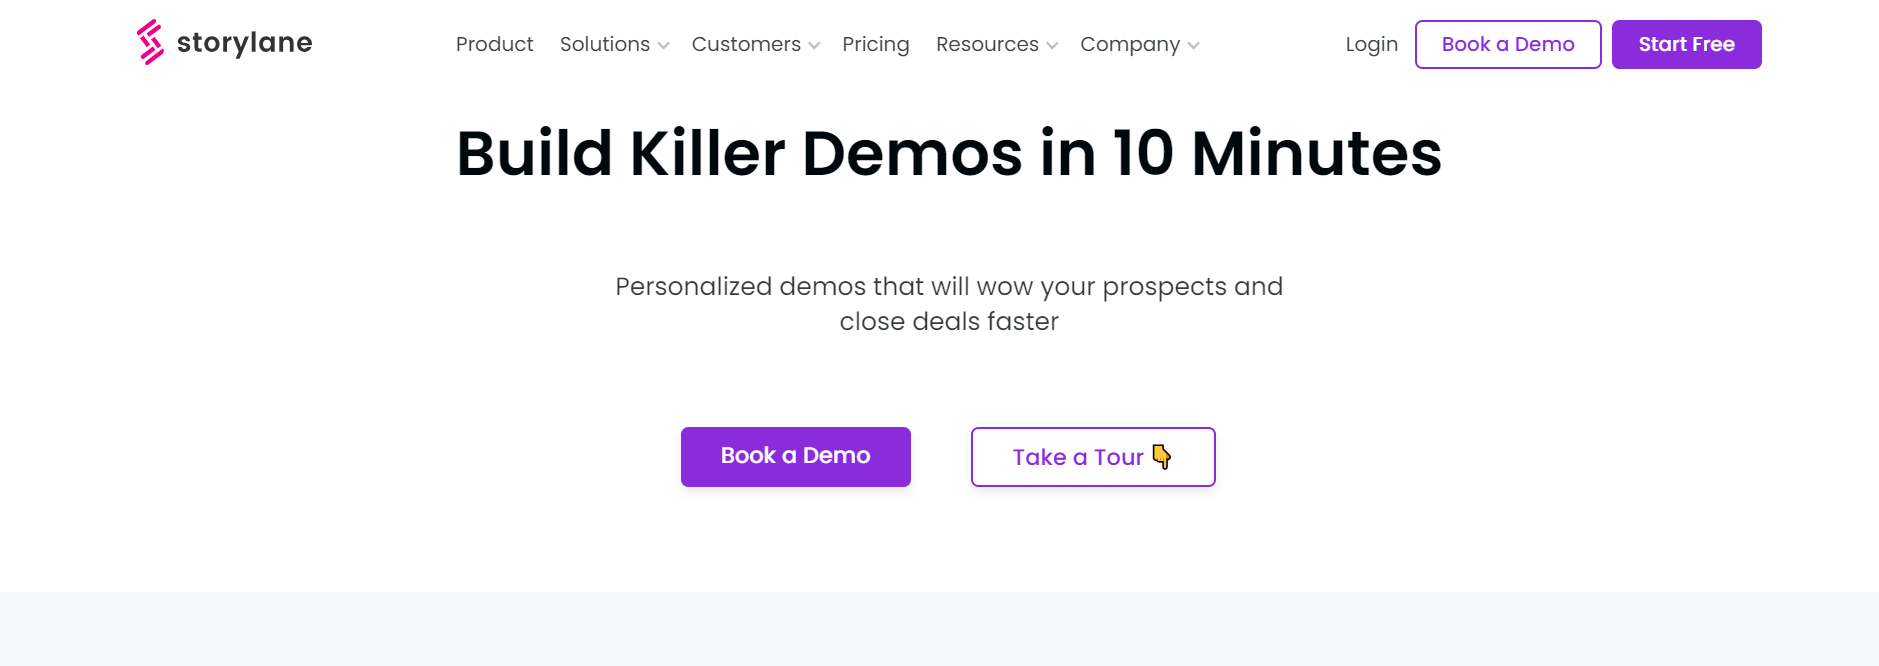
If you want to understand whether visitors to your website are moving forward in their journey, you need to get demo analytics. With Storylane’s demo performance analytics, you can calculate CTA percent and final step completion percent. These two metrics will help you understand how close or far visitors are from getting the free trial or freemium version of your product. With Storylane’s demo usage analytics, you can gather insights for each demo like impressions, CTAs clicked, time spent, completion, and more.
The Bottom Line
The right tools for measuring and analyzing product-led growth metrics are essential for the success of any SaaS company. Supademo is an exceptional option among the many available tools. Its AI-driven platform makes it easy to create and share interactive demos, which can provide valuable insights into user behavior.
By leveraging Supademo's capabilities, you can effectively track metrics such as product stickiness, churn rate, time to value, and more. These insights can help you optimize your product-led growth strategy, enhance user engagement, improve customer satisfaction, and drive sustainable growth.
Make Supademo your go-to tool and supercharge your journey to becoming a rising star in the SaaS industry.