
You can have the most innovative product, but if people don't use it, it might as well not exist.
The root issue often comes down to a lack of strategic attention on product engagement and product adoption – or simply conflating the two metrics.
While they may seem similar, understanding the nuances between these key metrics can significantly impact how a business strategizes product development and customer relationship management. Both are critical metrics for measuring the health and performance of products, growth, and customer success.
This comprehensive guide will explore the key differences between adoption metrics and engagement metrics and provide several tactical strategies to improve both.
Understanding Product Adoption Metrics
Product adoption metrics focus on the initial stages of a user's interaction with a product. They measure the rate at which new users start using a product or feature.
Key product adoption metrics include:
- Sign-Up Rate: The percentage of visitors who sign up for your product or service. This is often compared to website visitor counts to calculate overall website to sign-up conversions.
- Activation Rate: The proportion of new users who take a specific, desired action within the product. This metric varies greatly by industry and type of company. For instance, this can be "adding six friends" for Facebook, or "creating a demo and sharing it" for Supademo.
- Feature Adoption Rate: How often new users engage with a particular feature. This can be done on a singular or thematic batch of features (i.e. editing tools).
- Time to First Action: The time it takes for a new user to engage with your product after signing up. The faster you get them to act, the more sticky your product typically becomes.
- Time-to-Value: The time it took for the customer to arrive at the "aha" moment or the value moment in your product. Again, the faster you get folks to value or understanding it, the more likely they'll stick around.
Adoption metrics are crucial for understanding how well your product attracts and initiates new users.
Understanding Product Engagement Metrics
Product engagement metrics, on the other hand, measure how active and involved users are with your product over time. These metrics are indicators of how valuable and sticky your product is for your users. Common engagement metrics include:
- Daily/Monthly Active Users (DAU/MAU): The number of unique users who engage with your product daily or monthly. Products like Mixpanel, Amplitude, or Intercom help track these relatively easily.
- Session Length: The average time users spend on your product in a single session. Products like Hotjar or Fullstory capture these in addition to actual session recordings.
- Frequency of Use: How often users return to your product. This is a leading indicator of whether the user will churn or retain over time.
- User Retention Rate: The rate at which you retain users over a specific period. This can be based on usage retention or dollar retention – including Net Dollar Retention.
Engagement metrics help you understand the depth of the relationship between your users and your product.
Key Differences Between Product Adoption and Engagement
If you've gotten to this section, you already have an understanding of how adoption and engagement differ. In essence, the key difference lies in the stages of the customer journey they represent.
➡️ Product doption metrics are about the "firsts" – first interaction, first use, first action. They are leading retention indicators and measure how successful you are at getting users to try something new.
➡️ Product engagement metrics, however, are about the ongoing relationship – how users interact with your product over time. It measures how engaged your existing users are via metrics like time-spent, sessions, and frequency of use. They are often lagging indicators that take time to accrue. Engagement is also a leading indicator to whether you'll likely retain or churn that customers. Generally speaking, the more engaged = less likely to churn. Less engaged = more likely to churn.
A common mistake made by SaaS companies is to over-optimize for engagement at the expense of adoption. You end up with a core group of highly engaged users, but most people never even try your new stuff.
Another is overly focusing only on "firsts" (i.e. initial adoption of features), only to have users never come back after a month or two.
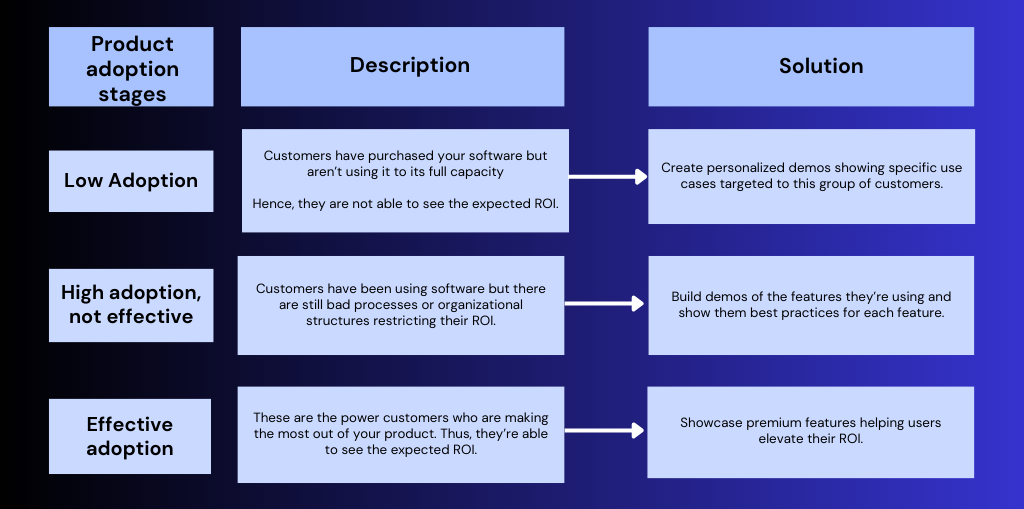
4 Tips to Improve Product Adoption Metrics
While there are many ways to drive user adoption, here are several strategies to drive this metric:
1. Simplify the Onboarding Process
Make the user's first experience as smooth and straightforward as possible. This includes simplifying the signup process and making onboarding self-paced, async, and accessible any time.
2. Clear Value Proposition
Ensure that your product's value is immediately apparent to new users. Your signup and onboarding flow should be focused on accelerating time-to-value and maximizing activation rate.
3. Leverage Self-Paced Education
Provide resources like tutorials, guides, and FAQs to help new users understand how to use your product. Leverage interactive demos within knowledge bases or training to visually guide customers step-by-step – humans are visual learners after all!

4. Leverage Feedback Loops
Collect and act on feedback from new users to continuously improve the adoption process. Regularly ask for customer feedback in all stages of their journey: when they first sign up, when they start using the product, when they become power users, and when they churn.
4 Tips to Improve Product Engagement Metrics
1. Personalization
Tailor the user experience based on individual user behavior and preferences. This starts from the initial signup flow, where you can personalize the setup of the user's dashboard based on their sign up answers.
Personalization is also effective for when onboarding users at scale – like using dynamic variables for "welcome demos" in onboarding emails:
2. Regular Updates and Documentation
Continuously update your product with new features and improvements based on user feedback. Extensive documentation on new features, technologies, and updates can be a driver for continued engagement from new and existing customers.

In fact, regular newsletters or product update emails can be a huge driver to re-activating churned customers or interested users that had forgoten about your product or service.
3. Community Building
Communities can be a huge driver to retaining power users or converting existing users into more frequent users. While this method takes considerable time and effort, you can take the first steps of building a community around your product through forums, social media, and events.
Slack communities are a natural medium for B2B companies looking to solicit feedback and get more engagement from their users.
4. Reward Loyalty
If you have loyal users, they're likely already recommending your product or services to their friends and family. By implementing formal affiliate, referral, or loyalty programs, you can gamify your platform for continued use.
Measuring and Analyzing Product Adoption and Engagement Metrics
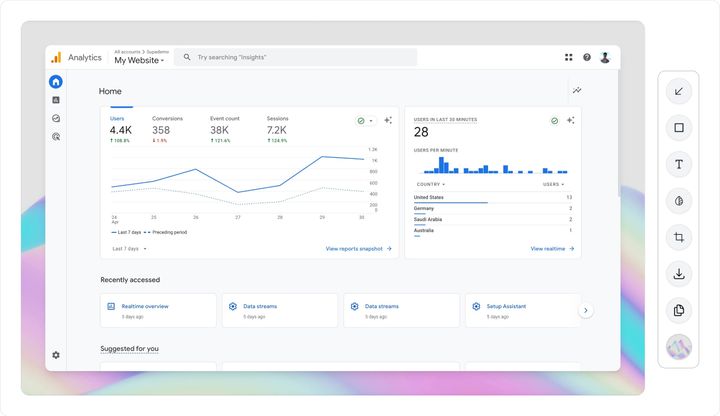
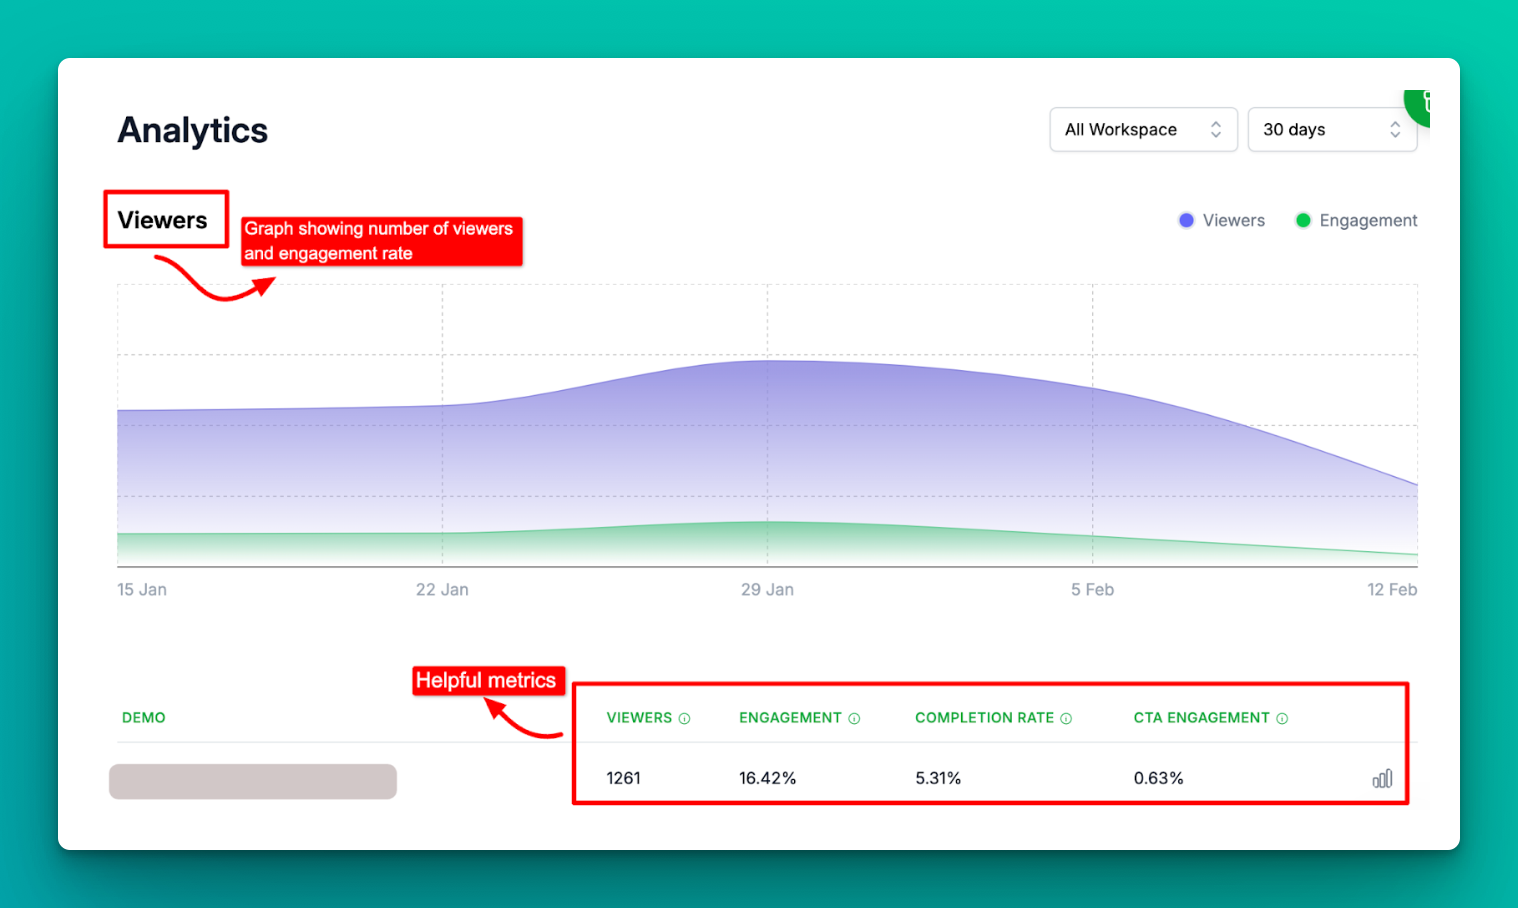
To effectively measure and analyze both sets of metrics, use analytics tools that track user behavior from the first interaction through to regular use.
Metrics to measure product adoption
- Sign-Up Rate
- Activation Rate
- Feature Adoption Rate
- Time to First Action
- Time-to-Value
Metrics to measure product engagement
- Daily/Monthly Active Users (DAU/MAU)
- Session Length
- Frequency of Use
- User Retention Rate
Popular tools for measuring adoption and engagement metrics include:
- Mixpanel: Offers in-depth analytics that go beyond basic metrics, allowing companies to understand user behavior in more detail.
- Heap: Known for its ability to automatically capture all user interactions, providing a comprehensive dataset for analysis without requiring manual tracking setup.
- Customer.io: Offers tools for improving user adoption through feature and event tracking, retention cohort analysis, and product adoption dashboards.
- Intercom: A customer communication platform that facilitates targeted interactions with customers through your website and within your web and mobile applications, aiming to enhance customer support and engagement.
- Amplitude: A comprehensive SaaS platform that provides businesses with sophisticated analytics to track user behavior and activity data, enabling them to gain actionable insights for optimizing user engagement and product development
- Hotjar: Known for its heatmaps and session recordings, which offer insights into how users interact with your website or app.
- FullStory: Offers session replay technology that helps in understanding user interactions on a website or app in great detail.
These tools vary in their specific features and capabilities, but all aim to provide insights into user behavior, engagement, and adoption.
We recommend regularly reviewing your adoption and engagement metrics (like the ones prefaced above) to understand trends, identify areas for improvement, and adjust your strategies accordingly.
Wrapping up!
Understanding and differentiating between product adoption and engagement metrics is crucial for any SaaS business. The first step is to understand the differences between the two. Next, it's a continuous process to improve both. Finally, you need to measure your outcomes and be data-driven to ensure adoption and engagement improve over time.
By focusing on the above strategies, you can ensure not only a great start for your users but also a lasting and evolving relationship with your product.
And, with Supademo, you can tactically improve both engagement and adoption by using high-converting, engaging product demos and guides. Best of all, you can create your first demo in seconds with no technical expertise required.
So, head over to Supademo to start creating engaging interactive demo – it's free!