State of Interactive Demos 2026
Explore data and insights from 0+ professionals and 0 interactive demos on how to drive impact across sales, customer success, marketing, and more.
TL;DR Overview
Explore the high-level research data from Supademo's 20-page interactive demo whitepaper.
Insights at a glance
Switch views by team to see how interactive demos are used across the organization.
Where in the customer journey does each team use interactive demos?
Where does each team see the impact of interactive demos?
Where does each team distribute their interactive demos?
How does AI usage lead to impact and time savings?
Average AI impact score for each team
Key findings
Interactive demos are now used across the entire organization.
78% of teams use demos in two or more use cases led by Customer Success, Product, Sales, and Marketing.
Using demos in more use cases and journey stages increases impact.
Teams that use demos for 3–5 use cases and across three or more journey stages report up to 29% higher scores than single-stage, single-use teams.
Top demos follow repeatable patterns.
"Hero demos" (high views and high completions) average 10–12 steps, clear 15–18 word hotspots, and simple linear flows, with completion rates above 80%.
AI and personalization multiply performance.
Teams that combine AI voiceovers, AI text, and light personalization see faster production, more consistent messaging, and stronger engagement.
Sharing demos cross-functionally improves alignment.
Teams report smoother feature rollouts, reduced support volume, stronger onboarding, and better internal consistency when Sales, CS, Product, and Support reuse the same demo library.
Freshness, distribution, and analytics separate mature programs.
Teams that update demos weekly or monthly, distribute them across 3–4 channels, and optimize based on analytics report significantly higher overall impact.
Why do interactive demos matter in 2026?
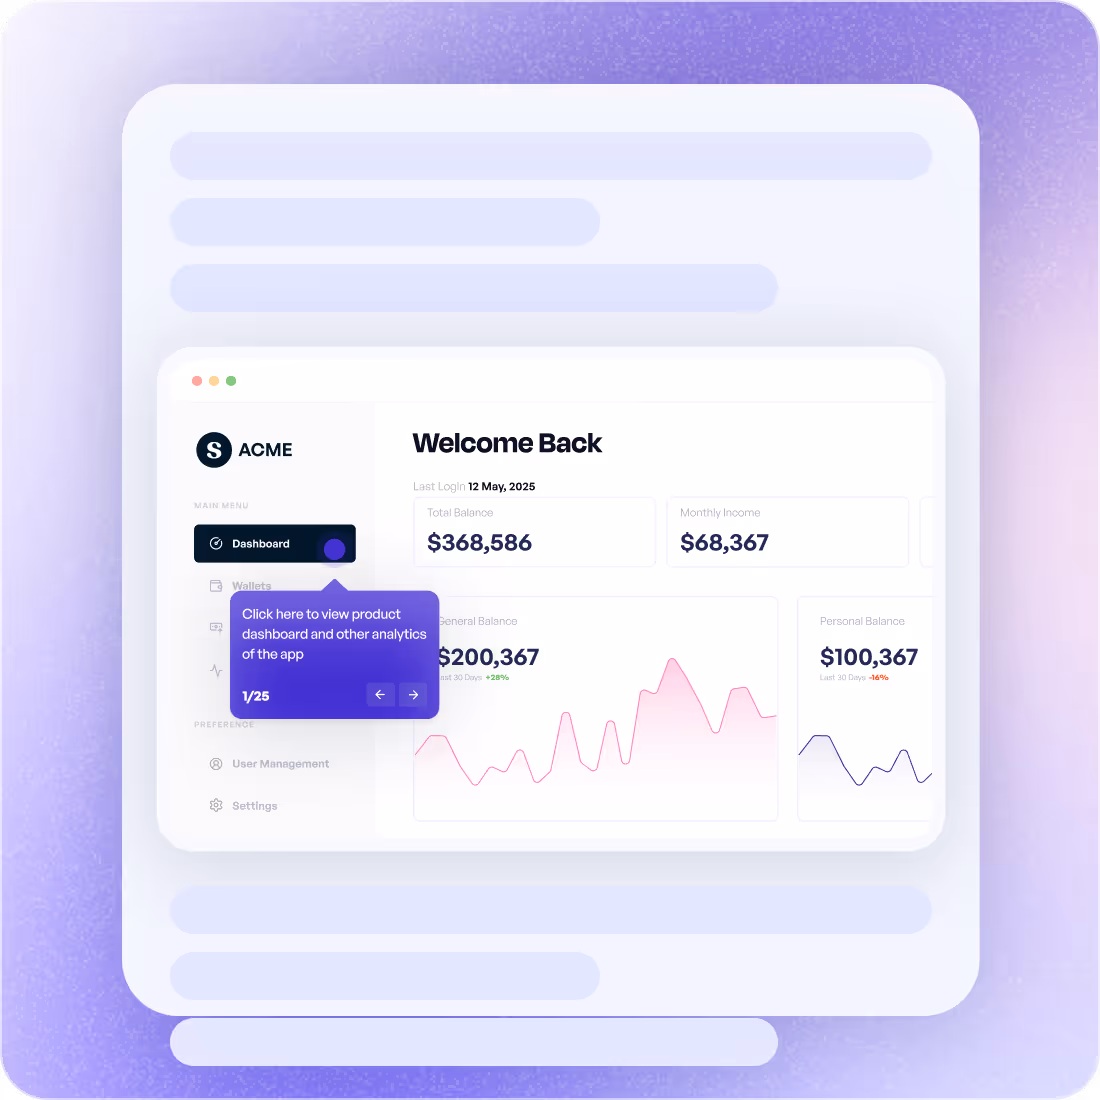
People (prospects, leads, users, buyers, etc.) expect hands-on understanding fast. Traditional formats, e.g., videos, screenshots, PDFs, slide decks, feel slow, static, and impossible to keep updated. Interactive demos in 2026 meet users where they are: in flow, in context, and in control.
Introduction
Video Recap: State of Interactive Demos 2026
If you are a professional or leader in Customer Success, Sales, Marketing, Product, Support, or Enablement, this State of Interactive Demos 2026 report is designed to answer three questions:
Why do interactive demos matter to my business right now?
How are other teams using demos across the customer journey and inside the organization?
What does a high-performing, scalable interactive demo program actually look like?
The findings in this report are based on two sources:
Survey of 200+ verified professionals
Professionals who use interactive demos in their day-to-day work. The questionnaire combined multiple-choice, rating scale, and open-text responses to capture both quantitative benchmarks and qualitative insights.
Performance analysis of thousands of demos
Interactive demos created in 2025, including the top 25% based on views and completion rates.
Together, these datasets provide a clear picture of how modern teams are building, sharing, and improving their interactive demos.
Who uses interactive demos in 2026?
Which departments use interactive demos?
Over 60% of respondents work in Customer Success, Sales, or Marketing. Product and Support represent another 22%. Emerging adoption in HR, Operations, and Leadership (16% combined) shows demos expanding into internal training and strategic initiatives.
Is interactive demo adoption driven top-down or bottom-up?
Interactive demos have earned a place in the strategic enablement stack. Nearly 64% of respondents are manager level or above, which means demo decisions now sit with people who own go-to-market and training priorities.
At the same time, individual contributors (36%) are the ones building and sharing demos day to day, so most interactive demo programs start as grassroots experiments inside teams and then scale once leaders see the impact on onboarding, productivity, and revenue.
How are interactive demos used across teams?
Interactive demos are used for more than just one job. Many different teams have found ways to plug them into their own workflows.
What are the use cases for interactive demos?
How is the cross-functional adoption of interactive demos?
Interactive demos are rarely single-purpose. About 78% of respondents use demos for two or more use cases, and 31% use them for four or more.
In most companies, once a useful interactive demo exists, it does not stay in one lane. It is reused wherever the same story needs to be told.
If your demos still live inside a single function, you are limiting an asset that could align how your company explains, launches, and supports the product.
What are common use case pairs?
High-performing teams that get the most from interactive demos treat them as a shared product narrative that different functions plug into, not as isolated assets sitting in one team's toolkit.
higher overall satisfaction
stronger ROI metrics
The more use cases a team covers, the more value they report. Teams using demos for 4+ use cases report these gains compared to single-use teams.
Why do teams adopt interactive demos?
We asked respondents what problem or gap drove them to adopt interactive demos. Responses clustered into five themes:
| Problem Category | % of Mentions | What It Means |
|---|---|---|
| Onboarding and Adoption | 45% | Time to value was too slow. Users needed faster, clearer paths into the product. |
| Training and Enablement | 28% | Internal teams or customers needed scalable, repeatable ways to learn complex workflows. |
| Marketing and Demand Gen | 15% | Static content wasn't driving engagement or conversion. Teams needed "show, don't tell" assets. |
| Support and Documentation | 8% | Help docs or videos couldn't keep up with product changes or weren't reducing support volume. |
| Sales Efficiency | 4% | Sales reps needed faster ways to demonstrate value or personalize experiences at scale. |
higher impact scores
Nearly half of all teams adopted interactive demos to solve onboarding friction. Teams that cite onboarding as the original driver report these higher impact scores for "reducing time to value."
How do interactive demos shape the customer journey?
Interactive demos are no longer just a mid-funnel asset. The data shows they are used from first customer touchpoint to account expansion, with clear hotspots where they are already embedded and gaps where they are still underused.
Interactive demos are heavily concentrated in Onboarding (63%), but Decision and Retention remain overlooked. Teams filling these gaps see the largest performance lift across revenue and adoption outcomes.
What is the impact of interactive demos?
Interactive demos influence core outcomes across sales, onboarding, support, marketing, and internal enablement by pushing each team closer to its main KPIs.
| Impact Area | Avg. Impact Score (1–5) | % Rating "High" or "Very High" |
|---|---|---|
| Onboarding and Adoption | 4.3 | 81% |
| Internal Enablement | 4.1 | 76% |
| Support and Self-Service | 3.9 | 68% |
| Marketing Engagement | 3.8 | 65% |
| Sales Efficiency | 3.7 | 62% |
| Product Launch Communication | 3.6 | 59% |
| Reducing Churn | 3.4 | 54% |
Key Insight
Interactive demos have the clearest, most widely agreed impact on onboarding, internal enablement, and support. Revenue and GTM impact are growing, especially when demos are used earlier in the customer journey.
How does the impact differ across multi-use adoption vs. single-use adoption?
Impact of interactive demos grows with the breadth of the use case.
Key Insight
Teams that use interactive demos in 3–5 use cases report much higher overall impact across onboarding, support, enablement, and revenue than those using interactive demos for a single use case only.
How does the impact differ if demos are used more across the customer journey?
gain over single-stage users
Teams see a clear lift once interactive demos cover three or more customer journey stages: impact jumps from 70% to 75% at three stages, and teams using demos across all five stages report 91% impact, tied to stronger revenue, better customer relationships, and more effective product education.
What is the impact of interactive demos on team collaboration?
Teams are treating interactive demos as a shared "source of truth" for how the product is explained, launched, and supported.
One shared product story across GTM teams
Smoother feature rollouts and internal training
Stronger feedback loops with the Product team
How do AI & personalization multiply interactive demo impact?
Personalization and AI are changing how teams create and ship interactive demos. The survey data shows that both are widely adopted. The performance data shows which tactics actually move the needle.
How do teams use personalization in interactive demos?
Key Insight
Most teams do not create bespoke demos for every prospect. Instead, they get most of the value from a small set of variants, using role-based, industry-specific, and light account-level personalization to make demos feel relevant without becoming unmanageable.
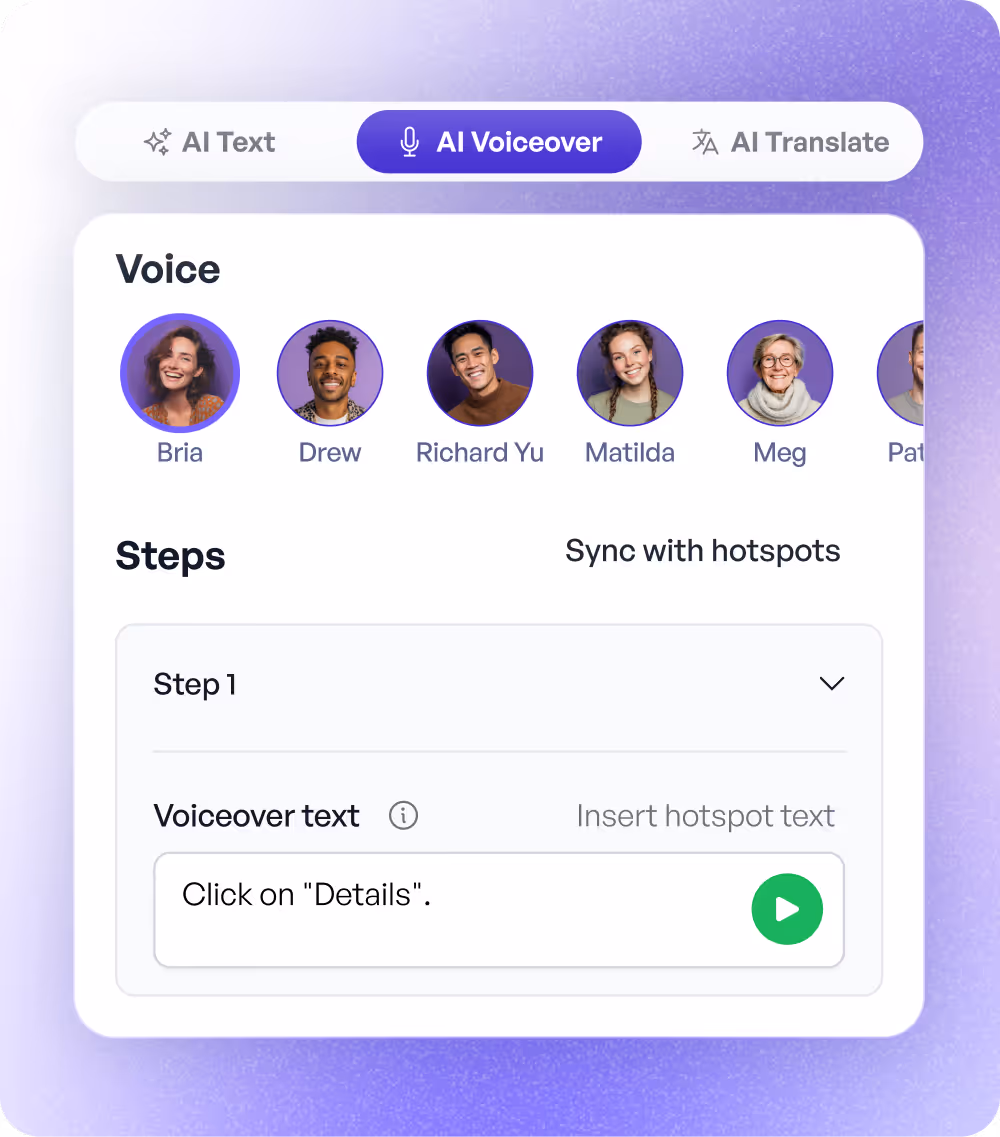
How do teams use AI in interactive demos?
Key Insight
Most teams are not using just one AI feature. The majority use two or three AI capabilities in combination, usually voice, text, and occasionally translation.
of top-completing demos use AI voiceover
We analyzed top-performing demos to find out that top-completing demos use AI voiceover at this rate, compared to 44.2% of average performers.
What do high-performing interactive demos have in common?
This section analyzes performance data from thousands of demos created in 2025, focusing on the top 1%, 10%, and 25% by views and completion rates.
High-performing demos aren't random outliers. Across thousands of demos, three repeatable patterns show up again and again: how the demo is structured, how it is maintained over time, and how widely it is distributed.
What is the performance spectrum of interactive demos?
If you want maximum views, build long, comprehensive demos. Top 1% demos average 18 steps with heavy chapter usage and live on high-traffic surfaces like websites and documentation. They stay active for nearly a year.
| Metric | Top viewed demos (reach-focused) | Top completed demos (completion-focused) |
|---|---|---|
| Avg step count | ~18 steps | ~12 steps |
| Avg completion rate | ~60% | ~80%+ |
| Use of chapters | ~60% use chapters | ~49% use chapters |
| Avg hotspot copy | ~11–12 words per hotspot | ~15–18 words per hotspot |
completion rates at scale
To maximize completion, keep demos short and clear. Top-completing demos average 12 steps, include more guidance per hotspot, and use simple linear flows.
If you want both? That's the so-called "Hero Demo" formula.
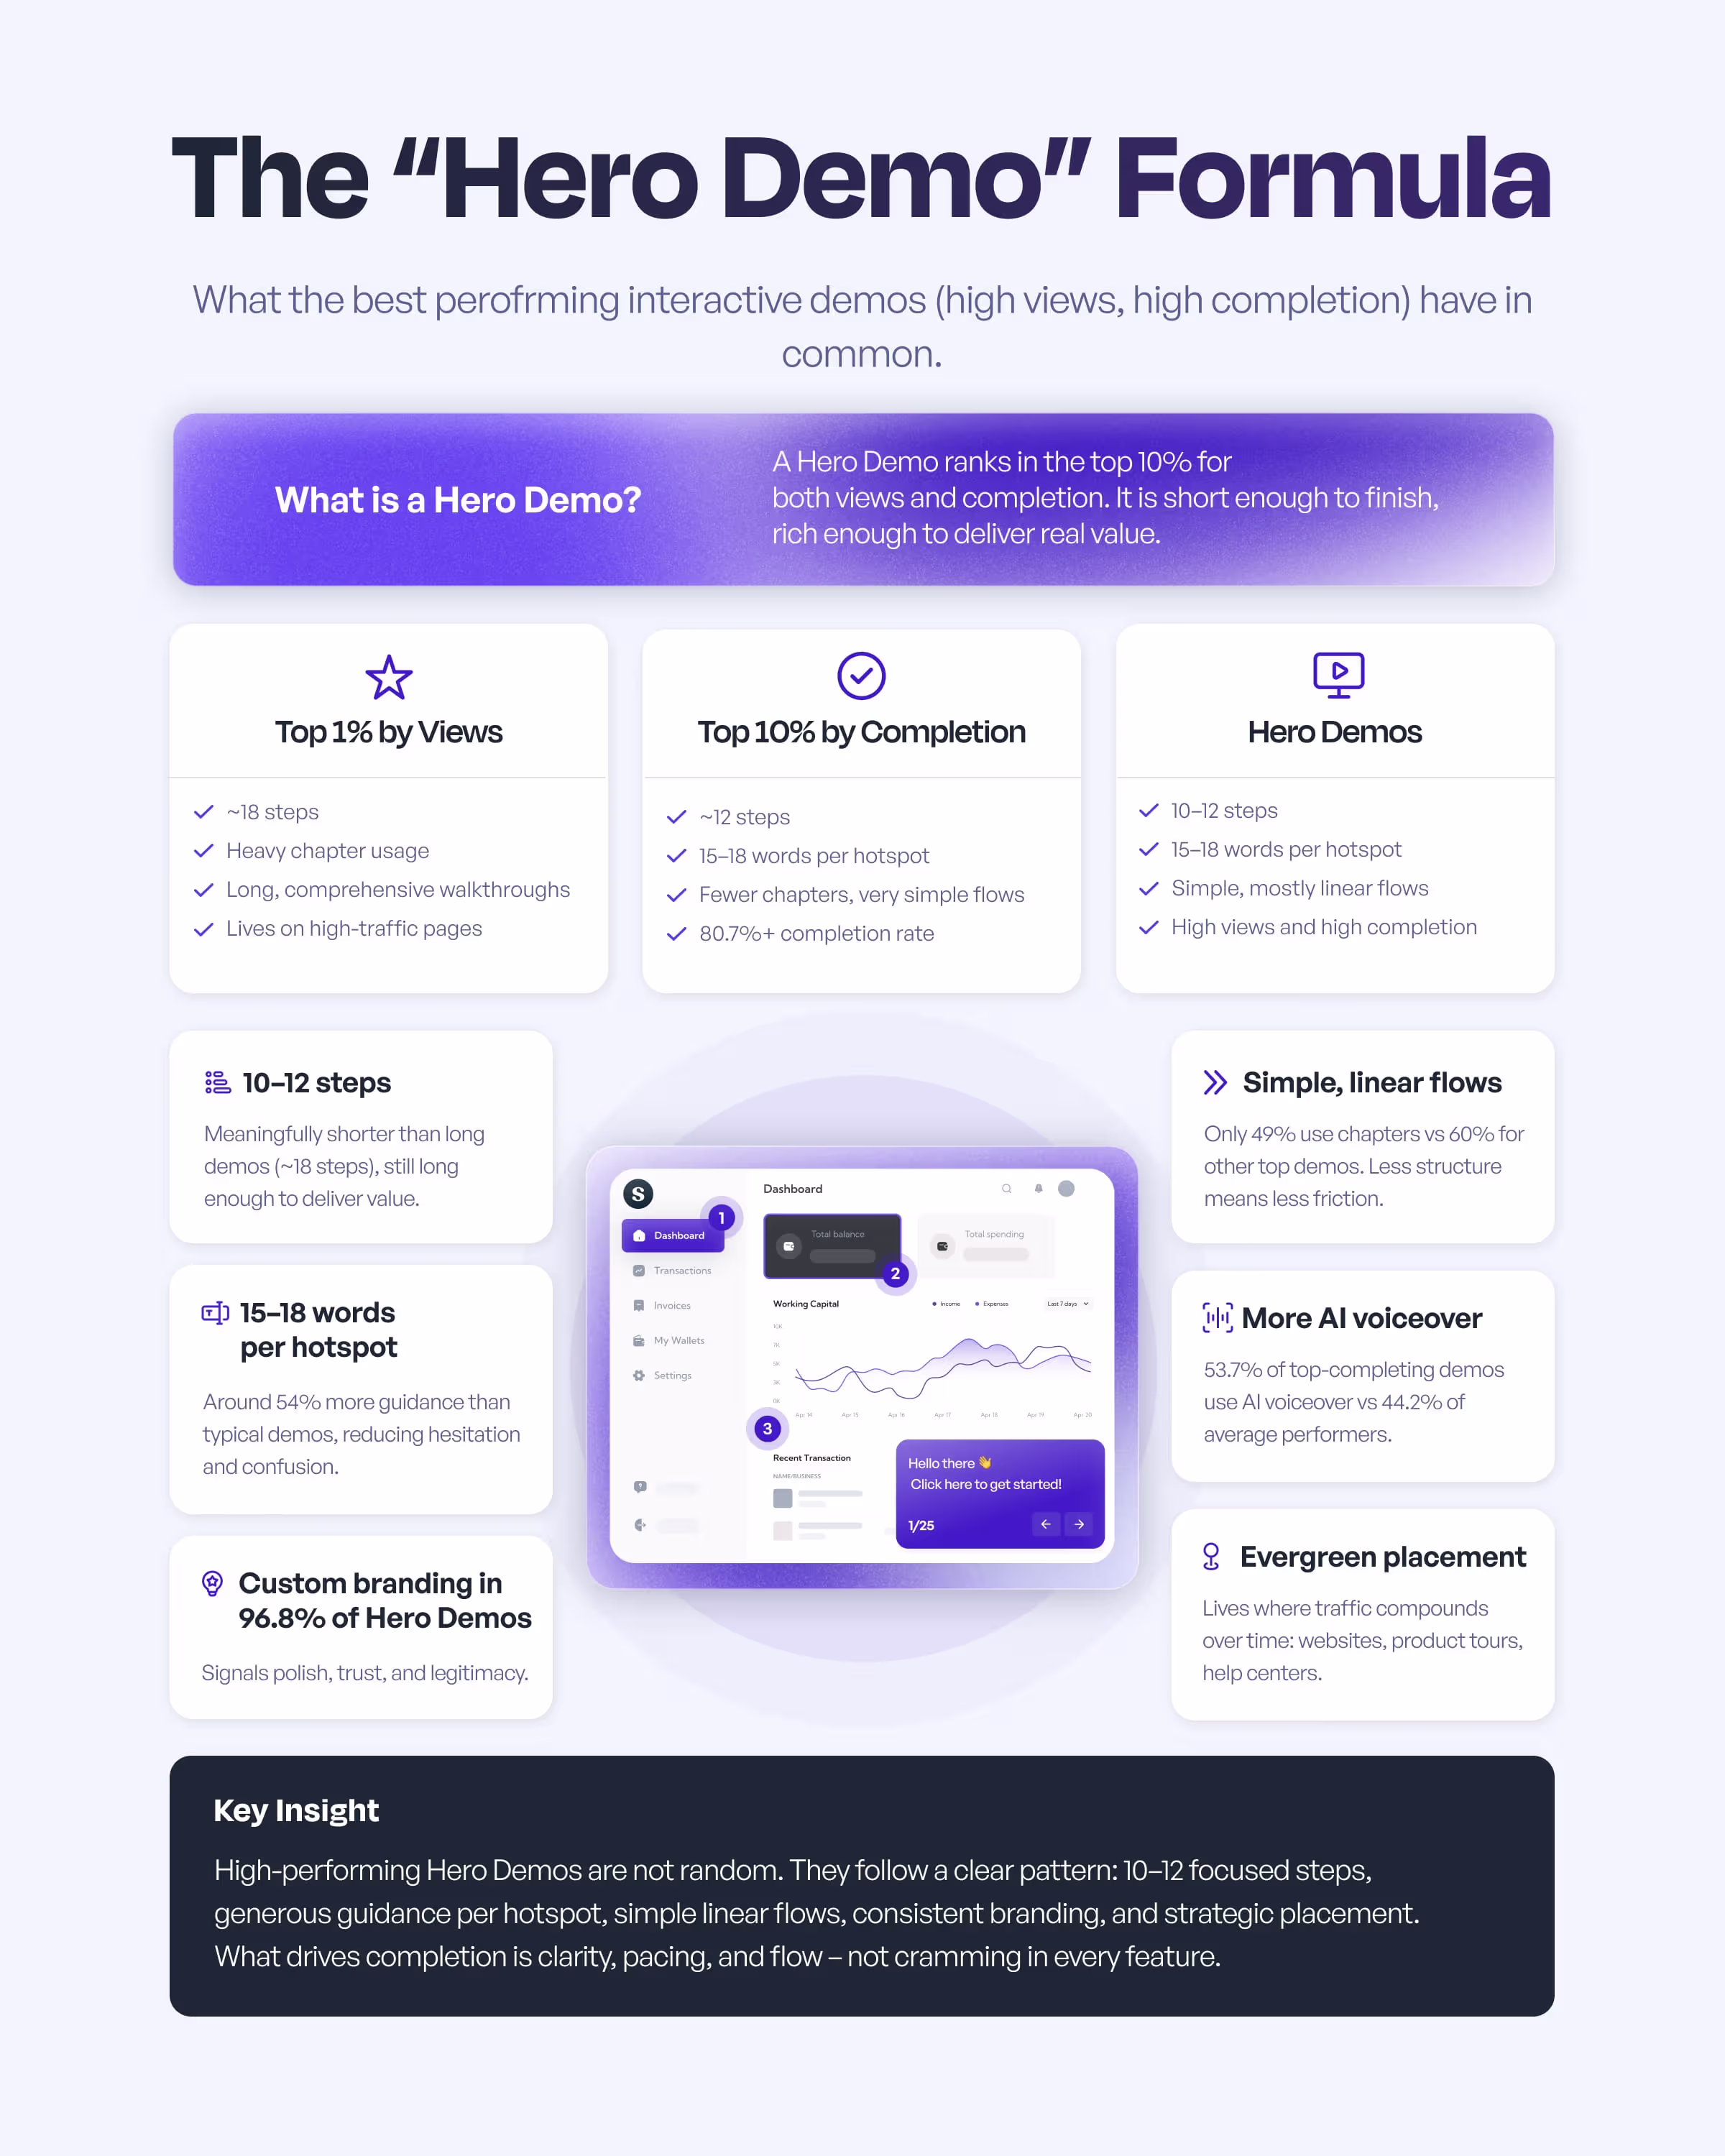
What is the "Hero Demo" formula?
"Hero demos" rank in the top 10% for both views and completion. They sit between long, reach-focused demos and short, completion-focused demos: short enough to finish, rich enough to deliver real value.
| Attribute | Benchmark | What It Indicates |
|---|---|---|
| Steps per demo | 10–12 steps | Shorter than top-viewed demos at 18 steps, but still delivers meaningful value. |
| Words per hotspot | 15–18 words | 54% more guidance than typical demos, reducing hesitation and keeping momentum. |
| Custom branding usage | 96.8% | Strong signal of polish and legitimacy among top performers. |
| Flow structure | Simple, linear flows | Only 49% use chapters vs. 60% of other top demos, reducing friction. |
| AI voiceover usage | 54% | Higher than average performers at 44.2%, correlating with improved outcomes. |
| Placement | Evergreen locations | Commonly placed on websites, product tours, and help centers where traffic compounds. |
How does the update cadence signal a mature interactive demo program?
How often you update interactive demos directly impacts performance.
impact for weekly/monthly updates
Teams that treat demos as living documentation see the biggest gains: those updating weekly or monthly report this impact, while teams that only update at major releases report just 67%, as their demos slowly go stale.
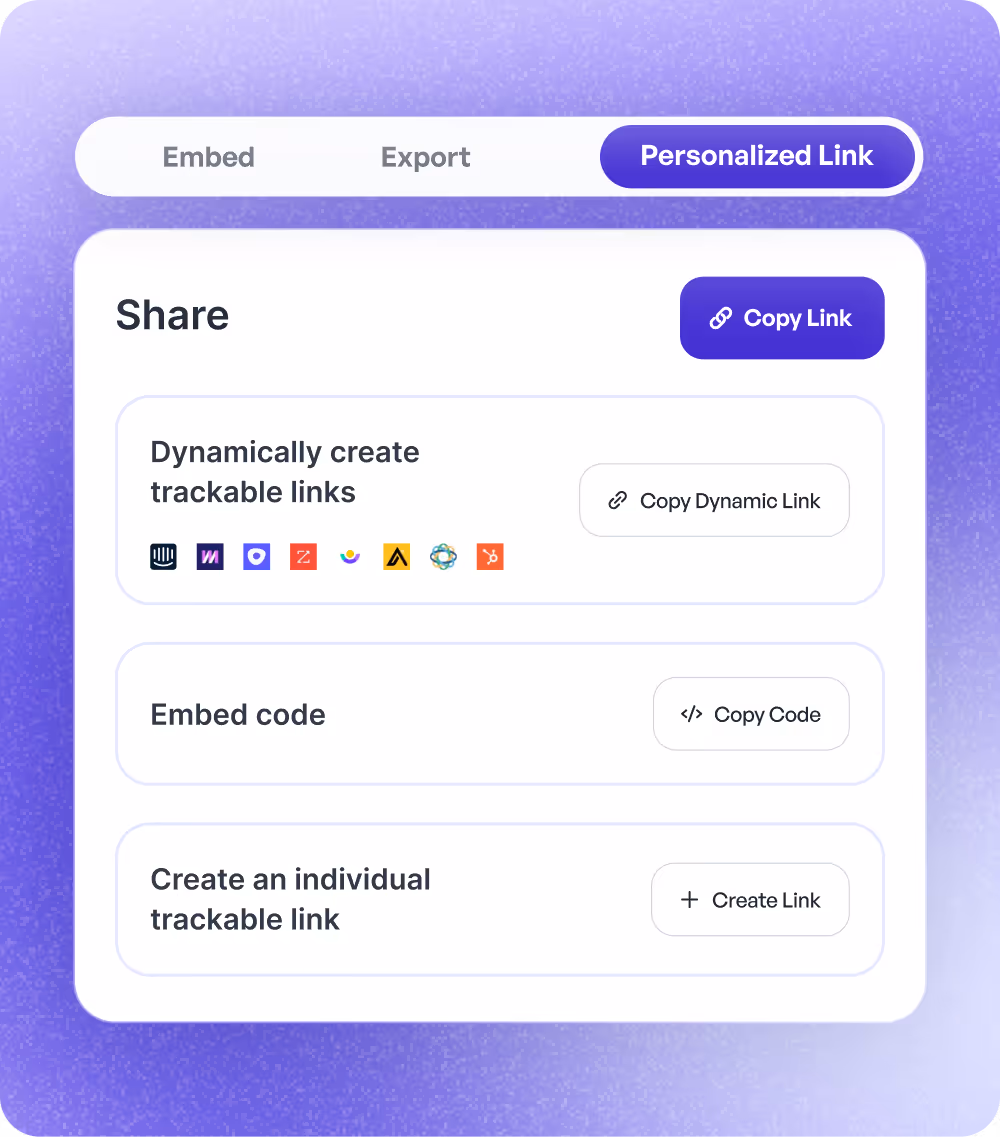
How does multi-channel distribution drive demo views?
Most teams distribute demos across 3-4 channels, not just one. This reflects maturity beyond using interactive demos for marketing alone.
How do teams use analytics to improve interactive demo performance?
Once demos are live, the question becomes: are people engaging, and is that engagement useful? Our data shows that most teams are past vanity views and use demo analytics to qualify leads, refine messaging, and improve product education.
What are the top ways teams use demo analytics?
Today, teams no longer just ask "How many views?" They ask, "What do we do with this signal?"
Here's how teams use demo analytics:
Teams that update their interactive demos regularly (e.g., weekly or monthly) report around 18% higher overall impact scores than teams that only update during major product releases.
What are the key takeaways of the State of Interactive Demos 2026?
Interactive demos are now a cross-functional standard
Interactive demos have moved beyond a niche asset. Over 60% of respondents work in Customer Success, Sales, or Marketing, with Product and Support close behind, and 78% use interactive demos in two or more use cases. Interactive demos are becoming the shared way teams explain, launch, and support the product.
Using demos in more use cases and stages increases impact
Impact grows as teams use demos in more places. Teams that use demos for three to five use cases report much higher overall impact than single-use teams. When demos cover three or more customer journey stages, impact jumps from 70% to 75%, and teams using demos across all five stages report 91% impact.
Onboarding and enablement are still the "killer apps"
The clearest, most widely agreed impact is on onboarding, internal enablement, and support. Demos help new users reach time to value faster, reduce repetitive support questions, and keep internal teams aligned on how features are supposed to work. Revenue and GTM impact are growing as more teams use demos earlier in the journey.
High-performing demos follow a repeatable blueprint
Top-performing demos are not random outliers. Hero demos that rank in the top 10% for both views and completion average 10 to 12 steps, use 15 to 18 words per hotspot, rely on simple linear flows, and almost always use custom branding. These demos achieve completion rates above 80% at scale.
AI and personalization multiply performance rather than replace it
Most teams use two or three AI capabilities together, most often AI voiceovers, AI text, and translation. Top-completing demos are more likely to use AI voiceover than average performers. Personalization is focused on a small number of variants, such as role-based, industry-specific, or light account-level tweaks, which keeps demo programs manageable while still feeling relevant.
Freshness and distribution are what separate mature interactive demo programs
How teams maintain and distribute demos has a direct link to outcomes. Teams that update demos weekly or monthly report significantly higher impact than those that only update at major releases, treating demos as living documentation rather than one-off launch assets. Most mature programs distribute demos across three to four channels, not just one, so each demo supports multiple touchpoints.
Analytics turn demos into intent signals, not vanity views
Teams are moving past simple view counts and using analytics to make decisions. They track completion, drop-off points, and conversion to next steps to qualify and prioritize leads, refine messaging, improve education content, and tighten feedback loops with Product. High-performing teams treat demo analytics as a source of buyer intent and product insight, not just a dashboard to glance at.
Thank you for reading!
We appreciate you taking the time to explore the State of Interactive Demos 2026. We hope these insights help you build, share, and optimize your interactive demo strategy for maximum impact.