Overview
Enhance your Google Sheets experience by efficiently adjusting column widths to accommodate your data. Improve readability and streamline data presentation by widening columns with this user-friendly guide. Explore a seamless process to adjust column width in Google Sheets, empowering you to optimize data visualization for enhanced efficiency and clarity in your spreadsheet management.
Who is Google Sheets best suited for?
Google Sheets is best suited for a wide range of professionals, including Financial Analysts, Project Managers, and Data Analysts. For example, Financial Analysts can use Google Sheets for budgeting and financial forecasting, Project Managers can leverage it for tracking project milestones and resource allocation, and Data Analysts can use it for organizing and analyzing datasets, all benefiting from Google Sheets' collaborative features and powerful data processing capabilities.
How to make a column wider in Google Sheets
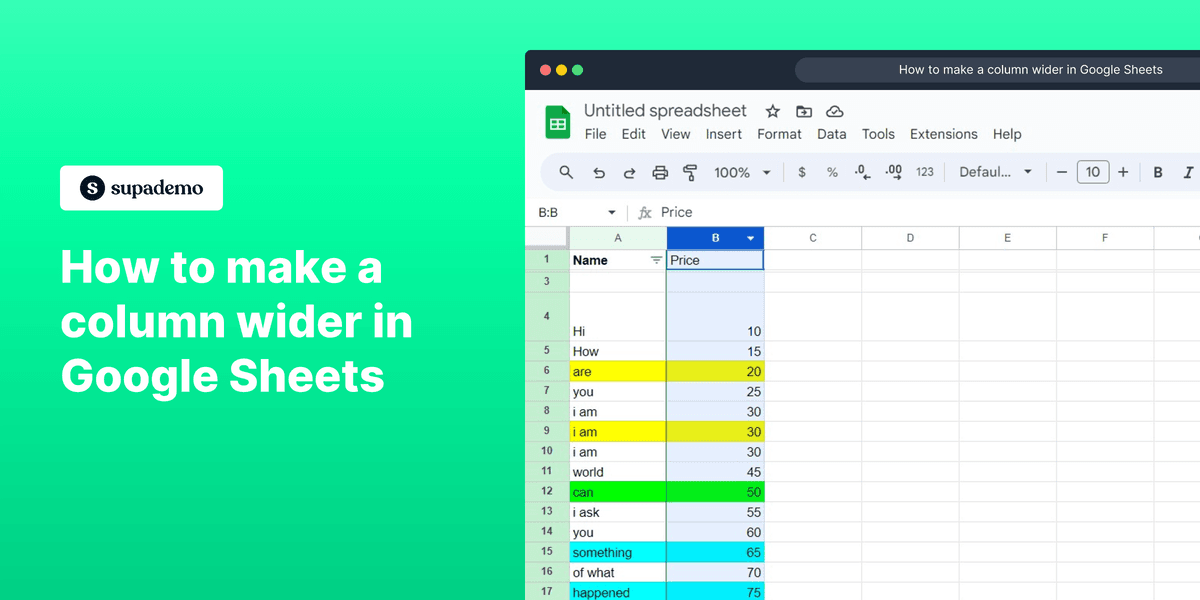
1. Initiate by clicking on the indicated area.
2. Next, grasp the edge and drag it outwards to widen the column.
3. Great job! You've successfully widened the column.
4. Continue by clicking the displayed icon.
5. Find and click on the 'Resize column' option.
6. To finalize, click on the 'OK' button.
7. Bravo! You've successfully widened another column as well.
Common FAQs on Google Sheets
Commonly asked questions about this topic.
How do I use formulas in Google Sheets?
How can I create a chart or graph in Google Sheets?
How do I filter data in Google Sheets?
Create your own step-by-step demo
Nithil Shanmugam
Nithil is a startup-obsessed operator focused on growth, sales and marketing. He's passionate about wearing different hats across startups to deliver real value.