Interactive Google Sheets Demo
Google Sheets is a browser-based spreadsheet that lets teams work on the same data simultaneously without emailing files back and forth. It covers formulas, pivot tables, charts, and scripted automation — all at no cost for anyone with a Google account.
What is Google Sheets?
Google Sheets is a free, browser-based spreadsheet application included with every Google account. It stores data in the cloud rather than on a local drive, so multiple users can edit the same spreadsheet at the same time with each person's changes visible in near real time. The application supports over 400 functions, covering everything from basic arithmetic and text manipulation to statistical analysis and financial modeling.
Pivot tables let users summarize large datasets by grouping and aggregating values across multiple dimensions without writing formulas. Charts and graphs generate directly from selected data ranges and update automatically when underlying data changes. For teams that need to pull in external data, ImportXML and ImportHTML functions can fetch structured content directly from web pages on a refresh schedule, without any API credentials.
Google Apps Script extends Sheets with a JavaScript-based automation environment. You can write scripts to manipulate spreadsheet data, send emails, generate PDFs, and trigger actions on a schedule or based on spreadsheet events. For teams that need dashboards connected to Sheets data, Looker Studio connects directly and refreshes with current values — a lightweight business intelligence layer built on top of data teams already maintain.
How to get started with Google Sheets
- 1
Open a new spreadsheet
Go to sheets.google.com and click the plus icon to start blank, or select a template for budgets, project tracking, schedules, or CRM. Your spreadsheet is saved automatically to Google Drive from the first keystroke.
- 2
Enter and format your data
Type data directly into cells or paste from another source. Use Format > Number to set cell types — currency, date, percentage — and Format > Conditional formatting to highlight cells based on their values, which makes patterns in large datasets visible at a glance.
- 3
Build formulas and use functions
Start any formula with an equals sign. Type the first few letters of a function name to see autocomplete suggestions with descriptions. For data lookups across sheets, VLOOKUP and XLOOKUP are the most commonly used functions; for conditional aggregation, SUMIF and COUNTIF cover most scenarios.
- 4
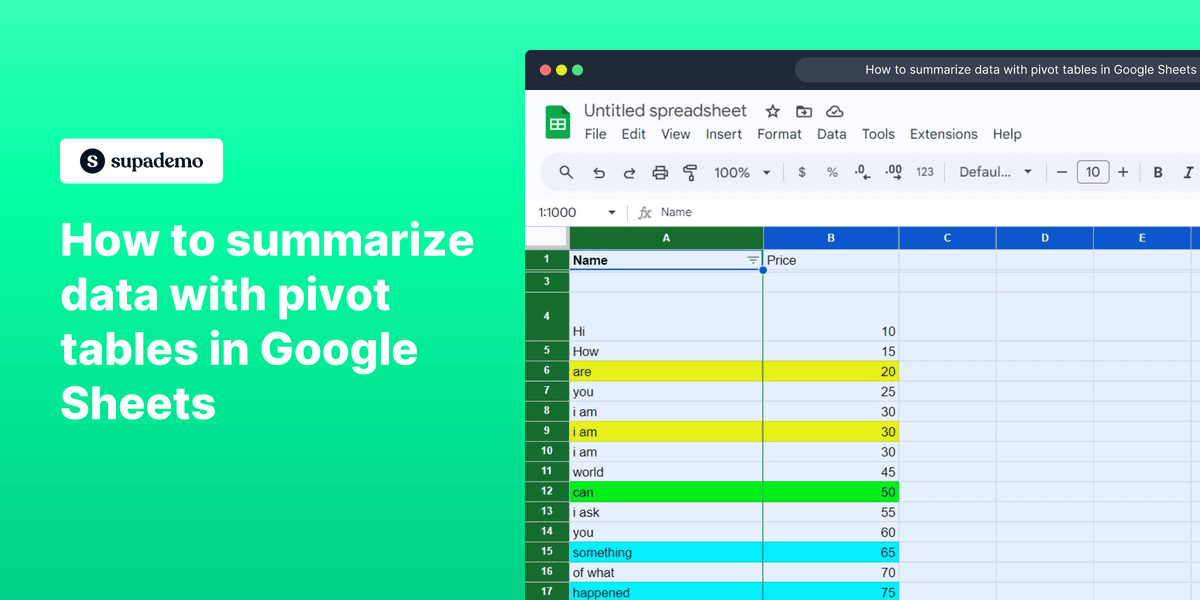
Create a pivot table to summarize data
Select your data range and go to Insert > Pivot table. Choose to insert it in a new sheet, then drag fields into Rows, Columns, and Values in the pivot table editor on the right. Start with one field per area to understand the output before adding more dimensions.
- 5
Share and set permissions
Click Share in the top-right corner, add email addresses or generate a link, and set the permission level. For data that only certain people should modify, right-click the sheet tab or a cell range and select Protect sheet or Protect range to restrict editing independently of overall share settings.
Explore more Google Sheets guides
Step-by-step interactive demos and tutorials for Google Sheets.
Who is Google Sheets most useful for?
Google Sheets is practical for any team that manages structured data and needs more than one person involved in maintaining it. Sales teams track pipeline stages, deal values, and close dates in Sheets and share views with managers without exporting files. Marketing teams manage content calendars, campaign budgets, and ad performance data in a shared sheet that everyone on the team can update. Operations teams use Sheets for capacity planning, vendor tracking, and process logs that feed into weekly reporting.
Data analysts who work in environments without enterprise BI tools use Sheets as a functional alternative. Pivot tables handle most aggregation needs for datasets under a few hundred thousand rows, and the QUERY function lets you write SQL-like statements against data ranges without leaving the spreadsheet. ImportXML and ImportHTML make it possible to pull competitor pricing or public data feeds into a live tracking sheet at no infrastructure cost.
Teams building training materials or product guides often find that static documentation doesn't scale well. That's where a tool like Supademo fits alongside Sheets: when a spreadsheet workflow needs to be turned into an interactive walkthrough for onboarding or sales enablement, Supademo captures those steps as a clickable demo that can be shared independently of the underlying spreadsheet. The two tools cover different parts of how a team works with and communicates about their data.
Google Sheets handles collaborative data work well, but other tools are worth considering when data structures, scale, or workflow requirements go beyond what a flat spreadsheet handles cleanly.
Excel has the most comprehensive formula and data analysis library of any spreadsheet tool, and its Power Query and Power Pivot features handle data transformation and modeling at a scale that Sheets doesn't match. For financial modeling, actuarial work, or any scenario requiring VBA automation, Excel remains the industry standard. The desktop application handles large files more reliably; Excel Online, included with Microsoft 365, approximates the Google Sheets browser-based experience.
View demo →
Airtable structures data in typed fields rather than generic cells, which reduces data entry errors and enables views like Kanban boards and calendars without reformatting data. Linked records let you relate rows across tables — connecting customers to their orders, for example — which is awkward to replicate cleanly in Sheets. The trade-off is that Airtable's free tier limits records per base and some views require paid plans.
View demo →
Notion databases can display the same records as a table, Kanban board, calendar, or gallery, and each record can open as a full document with rich formatting. This makes Notion more suited to project tracking and knowledge management than raw data analysis. For teams that want their spreadsheet-style data to live alongside meeting notes and documentation rather than in a separate application, Notion offers a unified workspace.
View demo →
Coda embeds tables with formula support directly inside documents, so a product spec can include a live status tracker in the same page as the written description. Its formula language is more structured than Sheets' and supports actions — buttons that trigger row creation, email sending, or API calls — without requiring a separate scripting environment. For teams that find the separation between their data and their documents creates friction, Coda reduces that gap.
FAQs on Google Sheets
Commonly asked questions about Google Sheets. Have more? Reach out and our team will be happy to help.
Is Google Sheets free to use?
Google Sheets is free for anyone with a Google account, with storage shared across Drive, Gmail, and Photos up to 15 GB. Google Workspace plans start at $6 per user per month and add larger storage, custom email domains, and admin controls, but the spreadsheet functionality itself is the same at both tiers.
Can Google Sheets open Excel files?
Google Sheets can open .xlsx files uploaded to Google Drive, either keeping them in Excel format or converting them to Sheets format. Most Excel features survive the conversion, though VBA macros do not run in Sheets. You can also download any Sheets file as an .xlsx for sharing with users who need the Excel format.
How do pivot tables work in Google Sheets?
Pivot tables in Google Sheets summarize large data ranges by grouping values and computing aggregates like sums, averages, and counts. Select your data range, go to Insert > Pivot table, then use the pivot table editor to drag fields into rows, columns, values, and filters. The table updates automatically when you change the configuration or when source data changes.
What is Google Apps Script and what can it do in Sheets?
Apps Script in Google Sheets is a JavaScript-based automation layer built into every spreadsheet. From the Extensions menu, you can write scripts to automate repetitive tasks — formatting data, sending email summaries, creating calendar events from spreadsheet rows, or calling external APIs. Scripts can run on a time-based trigger or fire in response to spreadsheet events like edits or form submissions.
How does Google Sheets compare to Airtable?
Airtable organizes data in relational tables with field types that match what the data actually is — checkboxes, attachments, linked records, date pickers — while Google Sheets treats everything as a cell in a grid. Airtable's views (Kanban, calendar, gallery) make the same data browsable in different layouts without creating separate sheets. Sheets has a deeper formula library and scripting ecosystem; Airtable is stronger for structured records that need to be viewed and edited by non-technical users.
Can multiple people edit a Google Sheet at the same time?
Multiple people can edit a Google Sheet simultaneously — each user's cursor and edits appear in real time, color-coded by user. You control who can edit by setting share permissions (Editor, Commenter, or Viewer) per person or via link. For larger teams, you can also protect specific ranges or sheets so only designated users can modify certain data. See also the Google Docs demo for real-time collaboration in Google's writing tools.